Investment Asset Classes: What Do You Really Need?

My Money Blog has partnered with CardRatings and may receive a commission from card issuers. Some or all of the card offers that appear on this site are from advertisers and may impact how and where card products appear on the site. MyMoneyBlog.com does not include all card companies or all available card offers. All opinions expressed are the author’s alone.

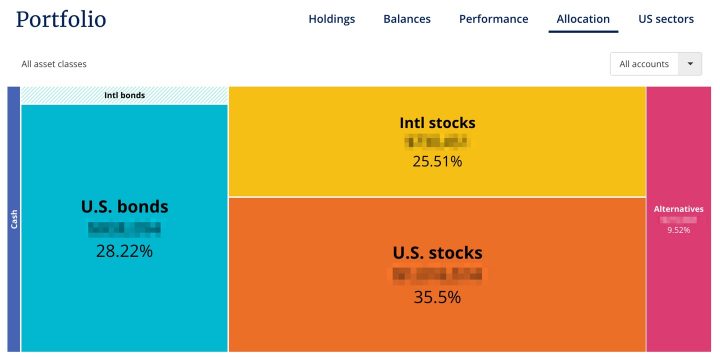
The Morningstar article Why Investment Complexity Is Not Your Friend points out that out of the thousands of available ETFs and mutuals available, most of them are so narrowly-focused that you really don’t even need to consider them.

What asset classes do you really need to own? Here is their no-nonsense list broken down by “definitely need”, “probably need”, and “don’t need”.

Agree? Disagree? I do believe you can still do quite well over the long run even if keeping things very simple.

My Money Blog has partnered with CardRatings and may receive a commission from card issuers. Some or all of the card offers that appear on this site are from advertisers and may impact how and where card products appear on the site. MyMoneyBlog.com does not include all card companies or all available card offers. All opinions expressed are the author’s alone, and has not been provided nor approved by any of the companies mentioned.

MyMoneyBlog.com is also a member of the Amazon Associate Program, and if you click through to Amazon and make a purchase, I may earn a small commission. Thank you for your support.


Best Interest Rates on Cash – April 2023

My Money Blog has partnered with CardRatings and may receive a commission from card issuers. Some or all of the card offers that appear on this site are from advertisers and may impact how and where card products appear on the site. MyMoneyBlog.com does not include all card companies or all available card offers. All opinions expressed are the author’s alone.

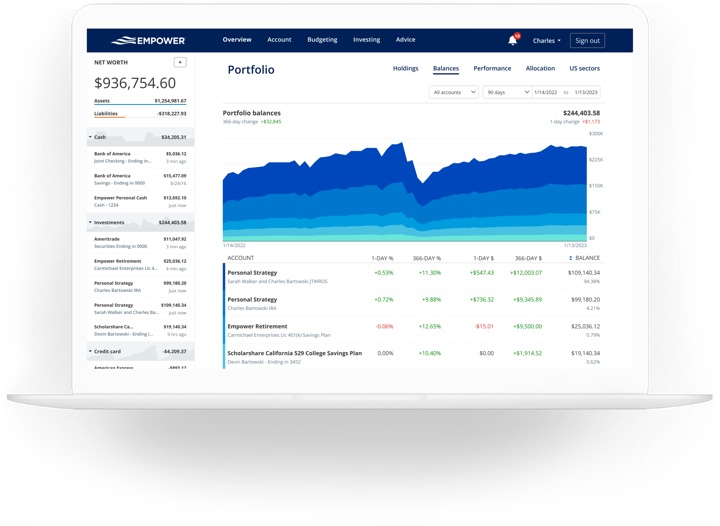
Here’s my monthly roundup of the best interest rates on cash as of April 2023, roughly sorted from shortest to longest maturities. We all need some safe assets for cash reserves or portfolio stability, and there are often lesser-known opportunities available to individual investors. Check out my Ultimate Rate-Chaser Calculator to see how much extra interest you could earn. Rates listed are available to everyone nationwide. Rates checked as of 4/5/2023.

TL;DR: 5% APY available on liquid savings, with some wrinkles. 5% APY available on multiple short-term CDs. Compare against Treasury bills and bonds at every maturity. 6.89% Savings I Bonds can be bought with 2023 annual limits now.

Fintech accounts
Available only to individual investors, fintech companies often pay higher-than-market rates in order to achieve fast short-term growth (often using venture capital). “Fintech” is usually a software layer on top of a partner bank’s FDIC insurance.

  • 4.85% APY ($1 minimum). SaveBetter lets you switch between different FDIC-insured banks and NCUA-insured credit unions easily without opening a new account every time, and their liquid savings rates currently top out at 4.85%. This fintech makes it easier for you to maintain a top rate even if one bank decides to drop out of the “rate race”. 😉 SaveBetter does not charge a fee to switch between banks.
  • 5% APY (before fees). MaxMyInterest is another service that allows you to access and switch between different FDIC-insured banks. You can view their current banks and APYs here. As of 4/5/23, the highest rate is from BrioDirect (Webster Bank) at 5.06% APY. However, note that they charge a membership fee of 0.04% per quarter, or 0.16% per year (subject to $20 minimum per quarter, or $80 per year). That means if you have a $10,000 balance, then $80 a year = 0.80% per year. You are allowed to cancel the service and keep the bank accounts, but then you may lose their specially-negotiated rates and cannot switch between banks anymore.
  • 5% on up to $25,000, then 4% up to $250k. Juno now pays 5% on all cash deposits up to $25,000 and 4% on cash deposits from $25,001 up to $250,000. No direct deposits required. This fintech has crypto exposure, please see my Juno review for details.
  • 4.00% APY on $6,000. Current offers 4% APY on up to $6,000 total ($2,000 each on three savings pods). Must maintain a direct deposit of $200+ every 35 days. $50 referral bonus for new members with $200+ direct deposit with promo code JONATHAP228. Please see my Current app review for details.

High-yield savings accounts
Since the huge megabanks STILL pay essentially no interest, everyone should have a separate, no-fee online savings account to piggy-back onto your existing checking account. The interest rates on savings accounts can drop at any time, so I list the top rates as well as competitive rates from banks with a history of competitive rates. Some banks will bait you with a temporary top rate and then lower the rates in the hopes that you are too lazy to leave.

  • The leapfrogging to be the temporary “top” rate continues. UFB Direct at 5.02% APY, although note their incoming ACH hold times. CIT Platinum Savings at 4.75% APY with $5,000+ balance.
  • SoFi Bank is now up to 4.00% APY + up to $275 new account bonus with direct deposit. You must maintain a direct deposit of any amount each month for the higher APY. SoFi has their own bank charter now so no longer a fintech by my definition. See details at $25 + $250 SoFi Money new account and deposit bonus.
  • There are several other established high-yield savings accounts at 3.75%+ APY that aren’t the absolute top rate, but historically do keep it relatively competitive for those that don’t want to keep switching banks.

Short-term guaranteed rates (1 year and under)
A common question is what to do with a big pile of cash that you’re waiting to deploy shortly (plan to buy a house soon, just sold your house, just sold your business, legal settlement, inheritance). My usual advice is to keep things simple and take your time. If not a savings account, then put it in a flexible short-term CD under the FDIC limits until you have a plan.

  • No Penalty CDs offer a fixed interest rate that can never go down, but you can still take out your money (once) without any fees if you want to use it elsewhere. CIT Bank has a 11-month No Penalty CD at 4.80% APY with a $1,000 minimum deposit. Ally Bank has a 11-month No Penalty CD at 4.35% APY for all balance tiers. Marcus has a 13-month No Penalty CD at 3.85% APY with a $500 minimum deposit. You may wish to open multiple CDs in smaller increments for more flexibility.
  • Marcus has a special 10-month CD at 5.05% APY with a $500 minimum deposit. Early withdrawal penalty is 90 days of interest.
  • BrioDirect has a 12-month certificate at 5.25% APY. $500 minimum. Early withdrawal penalty is 90 days of interest.
  • Western Alliance Bank via SaveBetter has a 12-month certificate at 5.01% APY. $1 minimum. Early withdrawal penalty is 270 days of interest.

Money market mutual funds + Ultra-short bond ETFs*
Many brokerage firms that pay out very little interest on their default cash sweep funds (and keep the difference for themselves). * Money market mutual funds are regulated, but ultimately not FDIC-insured, so I would still stick with highly reputable firms. I am including a few ultra-short bond ETFs as they may be your best cash alternative in a brokerage account, but they may experience losses.

  • Vanguard Federal Money Market Fund is the default sweep option for Vanguard brokerage accounts, which has an SEC yield of 4.77%. Odds are this is much higher than your own broker’s default cash sweep interest rate.
  • Vanguard Ultra-Short-Term Bond Fund currently pays 4.72% SEC yield ($3,000 min) and 4.82% SEC Yield ($50,000 min). The average duration is ~1 year, so there is some term interest rate risk.
  • The PIMCO Enhanced Short Maturity Active Bond ETF (MINT) has a 5.00% SEC yield and the iShares Short Maturity Bond ETF (NEAR) has a 4.98% SEC yield while holding a portfolio of investment-grade bonds with an average duration of ~6 months.

Treasury Bills and Ultra-short Treasury ETFs
Another option is to buy individual Treasury bills which come in a variety of maturities from 4-weeks to 52-weeks and are fully backed by the US government. You can also invest in ETFs that hold a rotating basket of short-term Treasury Bills for you, while charging a small management fee for doing so. T-bill interest is exempt from state and local income taxes.

  • You can build your own T-Bill ladder at TreasuryDirect.gov or via a brokerage account with a bond desk like Vanguard and Fidelity. Here are the current Treasury Bill rates. As of 4/5/23, a new 4-week T-Bill had the equivalent of 4.61% annualized interest and a 52-week T-Bill had the equivalent of 4.53% annualized interest.
  • The iShares 0-3 Month Treasury Bond ETF (SGOV) has a 4.60% SEC yield and effective duration of 0.10 years. SPDR Bloomberg Barclays 1-3 Month T-Bill ETF (BIL) has a 4.52% SEC yield and effective duration of 0.08 years.

US Savings Bonds
Series I Savings Bonds offer rates that are linked to inflation and backed by the US government. You must hold them for at least a year. If you redeem them within 5 years there is a penalty of the last 3 months of interest. The annual purchase limit for electronic I bonds is $10,000 per Social Security Number, available online at TreasuryDirect.gov. You can also buy an additional $5,000 in paper I bonds using your tax refund with IRS Form 8888.

  • “I Bonds” bought between November 2022 and April 2023 will earn a 6.89% rate for the first six months. The rate of the subsequent 6-month period will be based on inflation again. More on Savings Bonds here.
  • In mid-April 2023, the CPI will be announced and you will have a short period where you will have a very close estimate of the rate for the next 12 months. I will have another post up at that time.
  • See below about EE Bonds as a potential long-term bond alternative.

Rewards checking accounts
These unique checking accounts pay above-average interest rates, but with unique risks. You have to jump through certain hoops which usually involve 10+ debit card purchases each cycle, a certain number of ACH/direct deposits, and/or a certain number of logins per month. If you make a mistake (or they judge that you did) you risk earning zero interest for that month. Some folks don’t mind the extra work and attention required, while others would rather not bother. Rates can also drop suddenly, leaving a “bait-and-switch” feeling.

  • Genisys Credit Union pays 5.25% APY on up to $7,500 if you make 10 debit card purchases of $5+ each, and opt into receive only online statements. Anyone can join this credit union via $5 membership fee to join partner organization.
  • Pelican State Credit Union pays 5.11% APY on up to $10,000 if you make 15 debit card purchases, opt into receive only online statements, and make at least 1 direct deposit, online bill payment, or automatic payment (ACH) per statement cycle. Anyone can join this credit union via partner organization membership.
  • The Bank of Denver pays 5.00% APY on up to $15,000 if you make 12 debit card purchases of $5+ each, receive only online statements, and make at least 1 ACH credit or debit transaction per statement cycle. Thanks to reader Bill for the updated info.
  • All America/Redneck Bank pays 4.80% APY on up to $15,000 if you make 10 debit card purchases each monthly cycle with online statements.
  • Presidential Bank pays 4.625% APY on balances between $500 and up to $25,000 (3.625% APY above that) if you maintain a $500+ direct deposit and at least 7 electronic withdrawals per month (ATM, POS, ACH and Billpay counts).
  • Find a locally-restricted rewards checking account at DepositAccounts.

Certificates of deposit (greater than 1 year)
CDs offer higher rates, but come with an early withdrawal penalty. By finding a bank CD with a reasonable early withdrawal penalty, you can enjoy higher rates but maintain access in a true emergency. Alternatively, consider building a CD ladder of different maturity lengths (ex. 1/2/3/4/5-years) such that you have access to part of the ladder each year, but your blended interest rate is higher than a savings account. When one CD matures, use that money to buy another 5-year CD to keep the ladder going. Some CDs also offer “add-ons” where you can deposit more funds if rates drop.

  • Credit Human has 24-month to 35-month CDs at 5.50% APY. $500 minimum to open. The early withdrawal penalty is 365 days of interest. Anyone can join this credit union via partner organization (no fee).
  • Sallie Mae Bank via SaveBetter has a 27-month CD at 5.15% APY. $1 minimum. Early withdrawal penalty is 180 days of simple interest.
  • Lafayette Federal Credit Union has a 5-year certificate at 4.68% APY ($500 min), 4-year at 4.73% APY, 3-year at 4.84% APY, 2-year at 4.89% APY, and 1-year at 4.99% APY. They also have jumbo certificates with $100,000 minimums at even higher rates. The early withdrawal penalty for the 5-year is very high at 600 days of interest. Anyone can join this credit union via partner organization ($10 one-time fee).
  • You can buy certificates of deposit via the bond desks of Vanguard and Fidelity. You may need an account to see the rates. These “brokered CDs” offer FDIC insurance and easy laddering, but they don’t come with predictable early withdrawal penalties. Right now, I see a 5-year non-callable CD at 4.40% APY (callable: no, call protection: yes). Be wary of higher rates from callable CDs, which means they can call back your CD if rates drop later.

Longer-term Instruments
I’d use these with caution due to increased interest rate risk, but I still track them to see the rest of the current yield curve.

  • Willing to lock up your money for 10 years? You can buy long-term certificates of deposit via the bond desks of Vanguard and Fidelity. These “brokered CDs” offer FDIC insurance, but they don’t come with predictable early withdrawal penalties. You might find something that pays more than your other brokerage cash and Treasury options. Right now, I see a 10-year CDs at (none available, non-callable) vs. 3.67% for a 10-year Treasury. Watch out for higher rates from callable CDs where they can call your CD back if interest rates drop.
  • How about two decades? Series EE Savings Bonds are not indexed to inflation, but they have a unique guarantee that the value will double in value in 20 years, which equals a guaranteed return of 3.5% a year. However, if you don’t hold for that long, you’ll be stuck with the normal rate, currently 2.10% for EE bonds issued November 1, 2022 to April 30, 2023. As of 4/5/23, the 20-year Treasury Bond rate was 3.72%.

All rates were checked as of 4/5/2023.

My Money Blog has partnered with CardRatings and may receive a commission from card issuers. Some or all of the card offers that appear on this site are from advertisers and may impact how and where card products appear on the site. MyMoneyBlog.com does not include all card companies or all available card offers. All opinions expressed are the author’s alone, and has not been provided nor approved by any of the companies mentioned.

MyMoneyBlog.com is also a member of the Amazon Associate Program, and if you click through to Amazon and make a purchase, I may earn a small commission. Thank you for your support.


MMB Portfolio 2023 First Quarter Update: Dividend & Interest Income

My Money Blog has partnered with CardRatings and may receive a commission from card issuers. Some or all of the card offers that appear on this site are from advertisers and may impact how and where card products appear on the site. MyMoneyBlog.com does not include all card companies or all available card offers. All opinions expressed are the author’s alone.

Here’s my 2023 Q1 income update for my Humble Portfolio. I prefer to track the income produced as an alternative metric for performance. The total income goes up much more gradually and consistently than the number shown on brokerage statements (price), which helps encourage consistent investing. I imagine my portfolio as a factory that churns out dollar bills, a tree that gives dividend fruit.

Background about why I track dividends. Stock dividends are a portion of profits that businesses have decided to distribute directly to shareholders, as opposed to reinvesting into their business, paying back debt, or buying back shares. The dividends may suffer some short-term drops, but over the long run they have grown faster than inflation.

In the US, the dividend culture is somewhat conservative in that shareholders expect dividends to be stable and only go up. Thus the starting yield is lower, but grows more steadily with smaller cuts during hard times. Here is the historical growth of the trailing 12-month (ttm) dividend paid by the Vanguard Total US Stock ETF (VTI), courtesy of StockAnalysis.com.

European corporate culture tends to encourage paying out a higher (sometimes fixed) percentage of earnings as dividends, but that also means the dividends move up and down with earnings. Thus the starting yield is higher but may not grow as reliably. Here is the historical growth of the trailing 12-month (ttm) dividend paid by the Vanguard Total International Stock ETF (VXUS).

The dividend yield (dividends divided by price) also serve as a rough valuation metric. When stock prices drop, this percentage metric usually goes up – which makes me feel better in a bear market. When stock prices go up, this percentage metric usually goes down, which keeps me from getting too euphoric during a bull market. Here’s a related quote from Jack Bogle (source):

The true investor will do better if he forgets about the stock market and pays attention to his dividend returns and to the operating results of his companies. – Jack Bogle

My personal portfolio income history. I started tracking the income from my portfolio in 2014. Here’s what the annual distributions from my portfolio look like over time:

  • $1,000,000 invested in my portfolio as of January 2014 would started out paying ~$24,000 in annual income over the previous 12 months. (2.4% starting yield)
  • If I reinvested the dividends/interest every quarter but added no other contributions, as of April 2023 it would have generated ~$52,000 in annual income over the previous 12 months.
  • Even if I SPENT all the dividends/interest every quarter and added no other contributions, as of April 2023 it would have generated ~$40,000 in annual income over the previous 12 months.

This chart shows how the annual income generated by my portfolio has increased over time and with dividend reinvestment.

I’m using simple numbers to illustrate things, but isn’t that a nicer, gentler way to track your progress?

TTM income yield. To estimate the income from my portfolio, I use the weighted “TTM” or “12-Month Yield” from Morningstar (checked 4/2/23), which is the sum of the trailing 12 months of interest and dividend payments divided by the last month’s ending share price (NAV) plus any capital gains distributed (usually zero for index funds) over the same period. The trailing income yield for this quarter was 3.33%, as calculated below. Then I multiply by the current balance from my brokerage statements to get the total income.

Asset Class / Fund % of Portfolio Trailing 12-Month Yield Yield Contribution
US Total Stock (VTI) 30% 1.60% 0.48%
US Small Value (VBR) 5% 2.20% 0.11%
Int’l Total Stock (VXUS) 20% 2.94% 0.59%
Int’l Small Value (AVDV/EYLD) 5% 4.23% 0.21%
US Real Estate (VNQ) 10% 4.11% 0.41%
Inter-Term US Treasury Bonds (VGIT) 15% 1.89% 0.28%
Inflation-Linked Treasury Bonds (TIP) 15% 6.12% 0.92%
Totals 100% 3.00%


My ttm portfolio yield is now roughly 3.00%, a bit lower than last quarter’s value. That means if my portfolio had a value of $1,000,000 today, I would have received $30,000 in dividends and interest over the last 12 months. (This is not the same as the dividend yield commonly reported in stock quotes, which just multiplies the last quarterly dividend by four.) US dividend rate went down a bit, international dividend rate went down a bit, Treasury bond yield is catching up, TIPS yield is still high from tracking CPI inflation.

What about the 4% rule? For goal planning purposes, I support the simple 4% or 3% rule of thumb, which equates to a target of accumulating roughly 25 to 33 times your annual expenses. I would lean towards a 3% withdrawal rate if you want to retire young (closer to age 50) and a 4% withdrawal rate if retiring at a more traditional age (closer to 65). It’s just a quick and dirty target, not a number sent down from the heavens. During the accumulation stage, your time is better spent focusing on earning potential via better career moves, improving in your skillset, and/or looking for entrepreneurial opportunities where you can have an ownership interest.

As a semi-retired investor that has been partially supported by portfolio income for a while, I find that tracking income makes more tangible sense in my mind and is more useful for those who aren’t looking for a traditional retirement. Our dividends and interest income are not automatically reinvested. They are another “paycheck”. Then, as with a traditional paycheck, we can choose to either spend it or invest it again to compound things more quickly. Even if we spend the dividends, this portfolio paycheck will still grow over time (see real numbers above). You could use this money to cut back working hours, pursue a different career path, start a new business, take a sabbatical, perform charity or volunteer work, and so on.

Right now, I am trying to fully appreciate the “my kids still think I’m cool and want to spend time with me” period of my life. It won’t last much longer. I am consciously choosing to work when they are at school but also consciously turning down work that doesn’t fit my priorities and goals. This portfolio income helps me do that.

My Money Blog has partnered with CardRatings and may receive a commission from card issuers. Some or all of the card offers that appear on this site are from advertisers and may impact how and where card products appear on the site. MyMoneyBlog.com does not include all card companies or all available card offers. All opinions expressed are the author’s alone, and has not been provided nor approved by any of the companies mentioned.

MyMoneyBlog.com is also a member of the Amazon Associate Program, and if you click through to Amazon and make a purchase, I may earn a small commission. Thank you for your support.


MMB Humble Portfolio 2023 First Quarter Update: Asset Allocation & Performance

My Money Blog has partnered with CardRatings and may receive a commission from card issuers. Some or all of the card offers that appear on this site are from advertisers and may impact how and where card products appear on the site. MyMoneyBlog.com does not include all card companies or all available card offers. All opinions expressed are the author’s alone.

Here’s my quarterly update on my current investment holdings at the end of 2023 Q1, including our 401k/403b/IRAs and taxable brokerage accounts but excluding our residence and side portfolio of self-directed investments. Following the concept of skin in the game, the following is not a recommendation, but a sharing of our real, imperfect, low-cost, diversified DIY portfolio. Wouldn’t it be nice if everyone else did the same? (Many people do track the 13F filings of well-known investors.)

“Never ask anyone for their opinion, forecast, or recommendation. Just ask them what they have in their portfolio.” – Nassim Taleb

How I Track My Portfolio
Here’s how I track my portfolio across multiple brokers and account types. There are limited free options after Morningstar discontinued free access to their portfolio tracker. I use both Empower Personal Dashboard and a custom Google Spreadsheet to track my investment holdings:

  • The Empower Personal Dashboard real-time portfolio tracking tools (free) automatically logs into my different accounts, adds up my various balances, tracks my performance, and calculates my overall asset allocation daily.
  • Once a quarter, I also update my manual Google Spreadsheet (free to copy, instructions) because it helps me calculate how much I need in each asset class to rebalance back towards my target asset allocation. I also create a new tab each quarter, so I have an archive of my holdings dating back many years.

2023 Q1 Asset Allocation and YTD Performance
Here are updated performance and asset allocation charts, per the “Allocation” and “Holdings” tabs of my Personal Capital account.

Humble Portfolio Background. I call this my “Humble Portfolio” because it accepts the repeated findings that individuals cannot reliably time the market, and that persistence in above-average stock-picking and/or sector-picking is exceedingly rare. Charlie Munger believes that only 5% of professional money managers have the skill required to consistently beat the index averages after costs.

Costs matter and nearly everyone who sells outperformance, for some reason keeps charging even if they provide zero outperformance! By paying minimal costs including management fees, transaction spreads, and tax drag, you can essentially guarantee yourself above-average net performance over time.

I own broad, low-cost exposure to productive assets that will provide long-term returns above inflation, distribute income via dividends and interest, and finally offer some historical tendencies to balance each other out. I have faith in the long-term benefit of owning businesses worldwide, as well as the stability of high-quality US Treasury debt. My stock holdings roughly follow the total world market cap breakdown at roughly 60% US and 40% ex-US. I add just a little “spice” to the vanilla funds with the inclusion of “small value” ETFs for US, Developed International, and Emerging Markets stocks as well as additional real estate exposure through US REITs.

I strongly believe in the importance of knowing WHY you own something. Every asset class will eventually have a low period, and you must have strong faith during these periods to truly make your money. You have to keep owning and buying more stocks through the stock market crashes. You have to maintain and even buy more rental properties during a housing crunch, etc. A good sign is that if prices drop, you’ll want to buy more of that asset instead of less. I don’t have strong faith in the long-term results of commodities, gold, or bitcoin – so I don’t own them.

I do not spend a lot of time backtesting various model portfolios, as I don’t think picking through the details of the recent past will necessarily create superior future returns. You’ll find that whatever model portfolio is popular in the moment just happens to hold the asset class that has been the hottest recently as well.

Find productive assets that you believe in and understand, and just keep buying them through the ups and downs. Mine may be different than yours.

I have settled into a long-term target ratio of roughly 70% stocks and 30% bonds (or 2:1 ratio) within our investment strategy of buy, hold, and occasionally rebalance. My goal is more “perpetual income portfolio” as opposed to the more common “build up a big stash and hope it lasts until I die” portfolio. My target withdrawal rate is 3% or less. Here is a round-number breakdown of my target asset allocation.

  • 30% US Total Market
  • 5% US Small-Cap Value
  • 20% International Total Market
  • 5% International Small-Cap Value
  • 10% US Real Estate (REIT)
  • 15% US Treasury Nominal Bonds or FDIC-insured deposits
  • 15% US Treasury Inflation-Protected Bonds (or I Savings Bonds)

Commentary. The goal of this “Humble Portfolio” is to create sustainable income that keeps up with inflation to cover our household expenses. According to Empower, my portfolio went up about 4.9% YTD to 4/3/2023. There was only minor rebalancing with cashflows done this quarter.

Due to the rising real yield on TIPS and rising yields on nominal Treasuries and CDs, there is more incentive to micro-managed the bond side a little bit. When the real yields on individual long-term TIPS go above 1.5% and I have cash to reinvest into bonds, that is what I am buying. As usual, I am trying to maintain high yields across a 1 to 5 year ladder horizon by picking between savings accounts, no-penalty CD, longer-term 5-year CDs, and longer-term Treasuries. However, I am also balancing between the extra yield from opening a new account or just staying with an existing bank where I already have a relationship.

I’ll share about more about the income aspect in a separate post.

My Money Blog has partnered with CardRatings and may receive a commission from card issuers. Some or all of the card offers that appear on this site are from advertisers and may impact how and where card products appear on the site. MyMoneyBlog.com does not include all card companies or all available card offers. All opinions expressed are the author’s alone, and has not been provided nor approved by any of the companies mentioned.

MyMoneyBlog.com is also a member of the Amazon Associate Program, and if you click through to Amazon and make a purchase, I may earn a small commission. Thank you for your support.


Credit Suisse Global Investment Returns Yearbook 2023: The Equity Premium

My Money Blog has partnered with CardRatings and may receive a commission from card issuers. Some or all of the card offers that appear on this site are from advertisers and may impact how and where card products appear on the site. MyMoneyBlog.com does not include all card companies or all available card offers. All opinions expressed are the author’s alone.

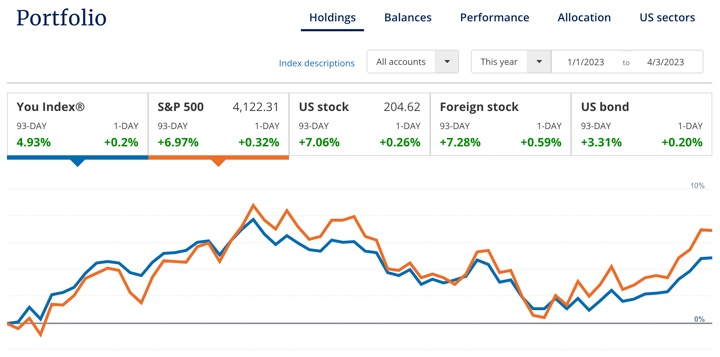
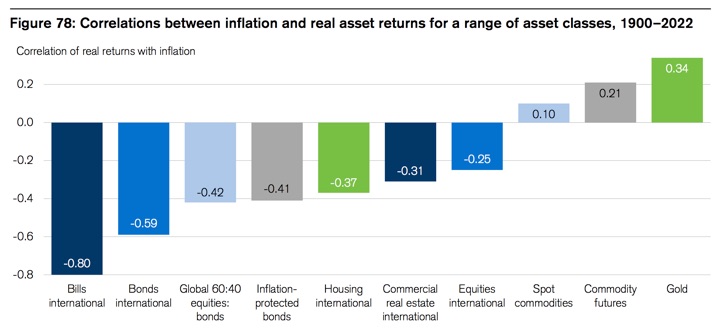
The 15th edition of the Credit Suisse Global Investment Returns Yearbook is available for free download in a
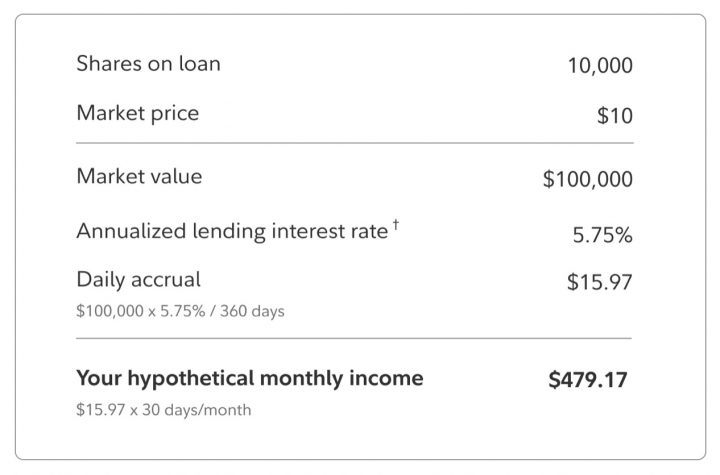
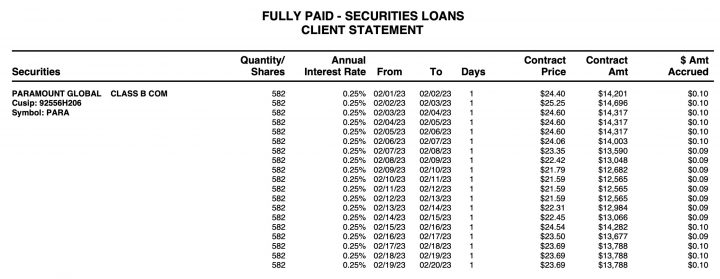
 54-page PDF Summary Edition version on the Credit Suisse website. This publication provides a nice “big picture” overview of the long-term performance of global financial assets:

The Credit Suisse Global Investment Returns Yearbook is based on a unique database that offers a historical record of the real returns from equities, bonds, cash and currencies for 35 countries. The data spans developed and emerging markets, and stretches back to 1900. As well as being an important source of rich data on long-term investment returns, the 2023 edition contains analysis on topical issues that investors face today.

(You may be more familiar with the collapse of Credit Suisse and it’s government-brokered rescue and takeover, but this is more of a collaboration with market historians than investment bankers. I do hope that they keep publishing it in the future.)

I recommend scrolling through just to look at the cool charts with data from 1900. Here are just a few quick examples. Here is a chart that tracks the relative market capitalizations of world equity markets since 1900.

Then there the differences in the historical annualized real returns for equities, long-term government bonds, and US Treasury bills (very short-term government bonds).

Here are the annualized real returns of those three asset classes over three different periods for the United States:

Here are the annualized real returns (in USD) of those three asset classes over three different periods for the rest of the world (World ex-US):

You can see that the “equity premium” is very significant (on average) worldwide over the history that we have available, and of course that is why most of us invest at least partially in stocks today.

My Money Blog has partnered with CardRatings and may receive a commission from card issuers. Some or all of the card offers that appear on this site are from advertisers and may impact how and where card products appear on the site. MyMoneyBlog.com does not include all card companies or all available card offers. All opinions expressed are the author’s alone, and has not been provided nor approved by any of the companies mentioned.

MyMoneyBlog.com is also a member of the Amazon Associate Program, and if you click through to Amazon and make a purchase, I may earn a small commission. Thank you for your support.


Bonds Are a Not a Hedge Against Stock Market Crashes (But Own Them Anyway)

My Money Blog has partnered with CardRatings and may receive a commission from card issuers. Some or all of the card offers that appear on this site are from advertisers and may impact how and where card products appear on the site. MyMoneyBlog.com does not include all card companies or all available card offers. All opinions expressed are the author’s alone.

Per Wikipedia, a financial “hedge” is an investment position intended to offset potential losses or gains that may be incurred by a companion investment. Wouldn’t be nice if for every Investment A, there was another Investment B that would always move in the opposite direction? Unfortunately, things aren’t so easy.

Here a reader e-mail that I definitely empathize with:

While I understand the dangers of performance-chasing, I’m getting more and more annoyed that bonds don’t do their jobs at stabilizing my portfolio. Last few years, they seem to have a positive correlation with stocks.

Things I’d love to better understand:
– say an ETF like BND, wouldn’t the fact that we know interests will be high for some foreseeable future already baked in the price of BND?
– Moving away from bonds at this point seems “late to the party” and market-timing…but like I said, I’m getting increasingly annoyed
– What could be good alternatives? What about dividend stocks such as the VIG ETF or some REITs?

Here’s a related excerpt from the Institutional Investor article Here’s Proof That Stocks Were Never an Inflation Hedge (emphasis mine):

Years of outsize returns also lulled investors on the correlation between stocks and bonds. Fixed income has historically acted as a portfolio stabilizer when markets are declining. When stocks tank, bonds have done well. But that correlation has changed over time.

From 1900-1949, Marsh explained, Credit Suisse found that the average correlation between stocks and bonds globally was 0.45, while from 1950 to 1999, the relationship had a correlation of 0.34.

As the authors wrote in the report: “The recent fortunes of 60/40 equity/bond strategies are a painful example of this, having trusted too heavily in the recent negative correlations between the two assets rather than properly consulting the history books.”

Here’s a direct quote from the Credit Suisse Global Investment Returns Yearbook 2023 (emphasis mine):

Many investors were caught off balance by the simultaneous fall in stocks and bonds and the poor performance of a classic 60:40 equity-bond portfolio (see Chapter 4). Over the previous two decades, investors had grown used to stocks and bonds providing a hedge for each other. However, we cautioned last year that this had been exceptional in the context of history. The negative correlation had been associated with a period of falling real interest rates, mostly accommodative monetary policy and generally low inflation, and we pointed out that “change was in the air.”

While bonds have had short periods of negative correlation with stocks, unfortunately the long term correlation is still moderately positive. In other words, bonds still tend to move in the same direction as stocks, just not as much. Bonds do have a stabilizing effect, but aren’t always an offsetting hedge to stock market drops.

I like to keep in mind that as interest rates rise, that means that the Fed has more room to cut rates quickly if a true recession occurs again and inflation cools. The Vanguard Total Bond ETF (BND) covers nearly the entire taxable bond universe and thus includes lots of different maturities with an average effective duration of about 6.5 years.

A useful rule of thumb is that for every 1% change in interest rates, the value of the bond will either increase or decrease by the same amount as its duration. So a 1% rate hike and it will go down 6.5%, and a 1% rate cut and it will go up 6.5%. If you want things more chill, you may want to pick a short duration and accept the lower returns.

If you zoom out on the Growth of $10,000 chart for the Vanguard Total Bond ETF, you can see it going up from the rate cuts and back down with the rate hikes. $10,000 invested in 2013 is worth about $11,000 today. That’s not a great rate of return but the ride was smooth compared to other asset classes, and with shorter-term bonds, it would have been even milder.

Higher yields also mean higher future returns. You may want to reconsider bailing out of bonds now. The Morningstar article The Return of the Bond Market summarizes the dynamic well:

Bonds have been painful and frustrating and have required a ton of patience.

But now the market has recalibrated, and yields have reset higher. Higher yields mean higher future returns. And for the first time in a while, you can make the argument that bonds provide true competition to stocks.

But a key aspect of the bond market is interest rates adjusting higher from zero, hurting most at the beginning. An increase in rates from 4% to 5% will be much less dramatic than the move from 1% to 2%, for the simple fact that if you’re getting paid a coupon of 4% to 5% and you reinvest, it has a tremendous compounding effect that isn’t replicated with 1%–2% yields.

In the end, I can’t predict future interest rates. If you want less sensitivity to interest rates, you should own shorter-term bonds or even just money market funds. Just know that if/when rates go down again, then BND will go back up a lot more than the money market fund. I personally hold a mix of cash/money market, short-term, and intermediate-term US Treasury bonds, CDs, and cash. I keep my overall average duration to less than 5 years. My overall yield is now close to 4%, rather than than 2%. These particular assets have a job in my portfolio as stabilizers, and I see them as still doing their job despite the losses when rates go up.

My Money Blog has partnered with CardRatings and may receive a commission from card issuers. Some or all of the card offers that appear on this site are from advertisers and may impact how and where card products appear on the site. MyMoneyBlog.com does not include all card companies or all available card offers. All opinions expressed are the author’s alone, and has not been provided nor approved by any of the companies mentioned.

MyMoneyBlog.com is also a member of the Amazon Associate Program, and if you click through to Amazon and make a purchase, I may earn a small commission. Thank you for your support.


Passive Income via Fidelity Securities Lending: Expectation vs. Reality

My Money Blog has partnered with CardRatings and may receive a commission from card issuers. Some or all of the card offers that appear on this site are from advertisers and may impact how and where card products appear on the site. MyMoneyBlog.com does not include all card companies or all available card offers. All opinions expressed are the author’s alone.

I just experienced my own version of the “Expectation vs. Reality” meme when I looked at my monthly report from my Fidelity Investments securities lending activities, where I lend out my stock shares and get paid interest. I had been getting a lot of transaction notifications where all my shares of Paramount (PARA) were being lend out to somebody (most likely to short it).

Expectation. I previously wrote about earning some extra income via Fully Paid Lending Programs in general, including that from Fidelity. In December 2021, Fidelity was showing this as an example scenario:

As of March 2023, the example scenario on the official Fidelity page shows a significantly lower income rate:

Still, over $400 a month of extra income from a $100,000 balance? I have a six-figure taxable Fidelity account, so I figured I was leaving money on the table! Let’s go!

Reality. Out of all my stock holdings, the only one to garner any lending interest was Paramount. This mostly makes sense in retrospect, as I tend to buy larger, high-quality companies when they are temporarily out of fashion. You don’t really see a lot of people shorting Berkshire Hathaway. Paramount is more of a value/cheap P/E and/or dividend play. (Although, Berkshire does own 10% or so of Paramount…)

Here are my real-world stats on Paramount:

Shares on loan: 582

Market price: ~$23

Market value: ~$13,386

Annualized lending interest rate: 0.25%

Daily accrual: ~$0.10 a day.

Monthly pro-rated income: $2.79

Actual income: $1.91 (only borrowed for 19 days)

So… basically I was making 10 cents a day lending out my $13,000 of Paramount shares. At that rate, even if I had $100,000 worth of Paramount, I’d be making roughly 77 cents a day, or $23 a month. Nowhere near the $479 a month example.

Add in the fact that PARA is the only security being lent out in my entire portolio, and my securities lending income is currently working out to a pro-rate amount of less than 0.0004%, or 0.04 basis points.

My Money Blog has partnered with CardRatings and may receive a commission from card issuers. Some or all of the card offers that appear on this site are from advertisers and may impact how and where card products appear on the site. MyMoneyBlog.com does not include all card companies or all available card offers. All opinions expressed are the author’s alone, and has not been provided nor approved by any of the companies mentioned.

MyMoneyBlog.com is also a member of the Amazon Associate Program, and if you click through to Amazon and make a purchase, I may earn a small commission. Thank you for your support.


Stocks Are Not an Inflation Hedge (But Own Them Anyway)

My Money Blog has partnered with CardRatings and may receive a commission from card issuers. Some or all of the card offers that appear on this site are from advertisers and may impact how and where card products appear on the site. MyMoneyBlog.com does not include all card companies or all available card offers. All opinions expressed are the author’s alone.

Per Wikipedia, a financial “hedge” is an investment position intended to offset potential losses or gains that may be incurred by a companion investment. Wouldn’t be nice if for every Investment A, there was another Investment B that would always move in the opposite direction? Unfortunately, things aren’t so easy.

A common question: Should we own stocks as a hedge against inflation? The Institutional Investor article Here’s Proof That Stocks Were Never an Inflation Hedge provides a little of clarification:

“Equities are not an inflation hedge. When inflation is high, they tend to do poorly. But in the long run, they have beaten inflation, so a lot of people claim they’re an inflation hedge, but [that claim is the result of confusion]. In the long run, stocks beat inflation, but they do it because of the equity risk premium. They are not an inflation hedge. They have a negative correlation with inflation,” said Marsh.

Historically, stocks actually tend to go down when inflation goes up.

Here’s a chart of the correlations between inflation and various asset classes over the last 120+ years from the Credit Suisse Global Investment Returns Yearbook 2023:

Here is Warren Buffett in his 2022 Berkshire Shareholder letter (emphasis mine):

During the decade ending in 2021, the United States Treasury received about $32.3 trillion in taxes while it spent $43.9 trillion.

Though economists, politicians and many of the public have opinions about the consequences of that huge imbalance, Charlie and I plead ignorance and firmly believe that near-term economic and market forecasts are worse than useless. Our job is to manage Berkshire’s operations and finances in a manner that will achieve an acceptable result over time and that will preserve the company’s unmatched staying power when financial panics or severe worldwide recessions occur. Berkshire also offers some modest protection from runaway inflation, but this attribute is far from perfect. Huge and entrenched fiscal deficits have consequences.

We can’t predict inflation, and we can’t expect stocks to go up when inflation does hit. However, we depend on businesses as a whole to continuously adapt (raising prices, lowering input costs, switching to alternative products, etc), so our best choice is to hold stocks and hope they continue to adapt through capitalism. If we only hold cash, we can only expect to break even after inflation at best, and usually go negative after taxes.

My Money Blog has partnered with CardRatings and may receive a commission from card issuers. Some or all of the card offers that appear on this site are from advertisers and may impact how and where card products appear on the site. MyMoneyBlog.com does not include all card companies or all available card offers. All opinions expressed are the author’s alone, and has not been provided nor approved by any of the companies mentioned.

MyMoneyBlog.com is also a member of the Amazon Associate Program, and if you click through to Amazon and make a purchase, I may earn a small commission. Thank you for your support.


How To Destroy Your Wealth

My Money Blog has partnered with CardRatings and may receive a commission from card issuers. Some or all of the card offers that appear on this site are from advertisers and may impact how and where card products appear on the site. MyMoneyBlog.com does not include all card companies or all available card offers. All opinions expressed are the author’s alone.

Charlie Munger and his principle of inversion tells us that sometimes the easiest way to achieve something is to flip it and consider the best ways to accomplish exactly what you are trying to avoid. Accordingly, check out this slide deck about Avoiding Financial Disasters by Barry Ritholtz (full 1-hour video presentation here).

If you would like to destroy your wealth, here are the top 10 ways to do so:

This may sound overly simple, but nearly every single wealthy person who has gone broke has used one of these methods. Obviously some of these are harder to avoid than others, but most are clearly identifiable and avoidable. Give them a wide berth. For example, if you had most of your net worth in shares of Silicon Valley Bank or Signature Bank, you may have made big gains for a while, but in the end be left with nothing. You should only have to get rich once.

Also see: How To Make Your Life Completely Miserable

(Top photo credit to Jp Valery on Unsplash)

My Money Blog has partnered with CardRatings and may receive a commission from card issuers. Some or all of the card offers that appear on this site are from advertisers and may impact how and where card products appear on the site. MyMoneyBlog.com does not include all card companies or all available card offers. All opinions expressed are the author’s alone, and has not been provided nor approved by any of the companies mentioned.

MyMoneyBlog.com is also a member of the Amazon Associate Program, and if you click through to Amazon and make a purchase, I may earn a small commission. Thank you for your support.


Best Interest Rates on Cash – March 2023

My Money Blog has partnered with CardRatings and may receive a commission from card issuers. Some or all of the card offers that appear on this site are from advertisers and may impact how and where card products appear on the site. MyMoneyBlog.com does not include all card companies or all available card offers. All opinions expressed are the author’s alone.

Here’s my monthly roundup of the best interest rates on cash as of March 2023, roughly sorted from shortest to longest maturities. We all need some safe assets for cash reserves or portfolio stability, and there are often lesser-known opportunities available to individual investors. Check out my Ultimate Rate-Chaser Calculator to see how much extra interest you could earn. Rates listed are available to everyone nationwide. Rates checked as of 3/7/2023.

TL;DR: 5% (fintech only) or 4.55% APY available on liquid savings. 5% APY available on multiple short-term CDs. Compare against Treasury bills and bonds at every maturity (12-month now above 5%). 6.89% Savings I Bonds can be bought with 2023 annual limits now.

Fintech accounts
Available only to individual investors, fintech companies often pay higher-than-market rates in order to achieve fast short-term growth (often using venture capital). “Fintech” is usually a software layer on top of a partner bank’s FDIC insurance.

  • 4.45% APY ($1 minimum). SaveBetter lets you switch between different FDIC-insured banks and NCUA-insured credit unions easily without opening a new account every time, and their liquid savings rates currently top out at 4.45%. This system makes it easier for you to maintain a top rate even if one bank decides to drop out of the “rate race”. 😉 There is usually another bank waiting in the wings that is still looking for deposits.
  • 5% on up to $25,000, then 4% up to $250k. Juno now pays 5% on all cash deposits up to $25,000 and 4% on cash deposits from $25,001 up to $250,000. No direct deposits required. $10 referral bonus. Please see my Juno review for details.
  • 4.00% APY on $6,000. Current offers 4% APY on up to $6,000 total ($2,000 each on three savings pods). Must maintain a direct deposit of $200+ every 35 days. $50 referral bonus for new members with $200+ direct deposit with promo code JENNIFEP185. Please see my Current app review for details.

High-yield savings accounts
Since the huge megabanks STILL pay essentially no interest, everyone should have a separate, no-fee online savings account to piggy-back onto your existing checking account. The interest rates on savings accounts can drop at any time, so I list the top rates as well as competitive rates from banks with a history of competitive rates. Some banks will bait you with a temporary top rate and then lower the rates in the hopes that you are too lazy to leave.

  • The leapfrogging to be the temporary “top” rate continues. UFB Direct at 4.55% APY. All America/Redneck Bank is at 4.25% APY for balances up to $75,000 ($500 to open, no min balance). Primis Bank dropped their rate, but grandfathered existing customers for the time being.
  • SoFi Bank is now up to 3.75% APY + up to $275 new account bonus with direct deposit. You must maintain a direct deposit of any amount each month for the higher APY. SoFi has their own bank charter now so no longer a fintech by my definition. See details at $25 + $250 SoFi Money new account and deposit bonus.
  • There are several other established high-yield savings accounts at 3.40%+ APY that aren’t the absolute top rate, but historically do keep it relatively competitive for those that don’t want to keep switching banks.

Short-term guaranteed rates (1 year and under)
A common question is what to do with a big pile of cash that you’re waiting to deploy shortly (plan to buy a house soon, just sold your house, just sold your business, legal settlement, inheritance). My usual advice is to keep things simple and take your time. If not a savings account, then put it in a flexible short-term CD under the FDIC limits until you have a plan.

  • No Penalty CDs offer a fixed interest rate that can never go down, but you can still take out your money (once) without any fees if you want to use it elsewhere. CIT Bank has a 11-month No Penalty CD at 4.10% APY with a $1,000 minimum deposit. Ally Bank has a 11-month No Penalty CD at 4.00% APY for all balance tiers. Marcus has a 13-month No Penalty CD at 3.85% APY with a $500 minimum deposit. You may wish to open multiple CDs in smaller increments for more flexibility.
  • Western Alliance Bank via SaveBetter has a 12-month certificate at 5.01% APY. $1 minimum. Early withdrawal penalty is 270 days of interest.
  • BMO Harris has a 12-month certificate at 5.00% APY. $1,000 minimum. Early withdrawal penalty is 180 days of interest.
  • Capital One Bank has a special 11-month certificate at 5.00% APY. Offer ends 3/14/23. No minimum deposit, early withdrawal penalty of 3 months of interest.

Money market mutual funds + Ultra-short bond ETFs*
Many brokerage firms that pay out very little interest on their default cash sweep funds (and keep the difference for themselves). * Money market mutual funds are regulated, but ultimately not FDIC-insured, so I would still stick with highly reputable firms. I am including a few ultra-short bond ETFs as they may be your best cash alternative in a brokerage account, but they may experience losses.

  • Vanguard Federal Money Market Fund is the default sweep option for Vanguard brokerage accounts, which has an SEC yield of 4.51%. Odds are this is much higher than your own broker’s default cash sweep interest rate.
  • Vanguard Ultra-Short-Term Bond Fund currently pays 4.54% SEC yield ($3,000 min) and 4.64% SEC Yield ($50,000 min). The average duration is ~1 year, so there is some term interest rate risk.
  • The PIMCO Enhanced Short Maturity Active Bond ETF (MINT) has a 4.71% SEC yield and the iShares Short Maturity Bond ETF (NEAR) has a 4.79% SEC yield while holding a portfolio of investment-grade bonds with an average duration of ~6 months.

Treasury Bills and Ultra-short Treasury ETFs
Another option is to buy individual Treasury bills which come in a variety of maturities from 4-weeks to 52-weeks and are fully backed by the US government. You can also invest in ETFs that hold a rotating basket of short-term Treasury Bills for you, while charging a small management fee for doing so. T-bill interest is exempt from state and local income taxes.

  • You can build your own T-Bill ladder at TreasuryDirect.gov or via a brokerage account with a bond desk like Vanguard and Fidelity. Here are the current Treasury Bill rates. As of 3/6/23, a new 4-week T-Bill had the equivalent of 4.68% annualized interest and a 52-week T-Bill had the equivalent of 5.06% annualized interest.
  • The iShares 0-3 Month Treasury Bond ETF (SGOV) has a 4.41% SEC yield and effective duration of 0.10 years. SPDR Bloomberg Barclays 1-3 Month T-Bill ETF (BIL) has a 4.34% SEC yield and effective duration of 0.08 years.

US Savings Bonds
Series I Savings Bonds offer rates that are linked to inflation and backed by the US government. You must hold them for at least a year. If you redeem them within 5 years there is a penalty of the last 3 months of interest. The annual purchase limit for electronic I bonds is $10,000 per Social Security Number, available online at TreasuryDirect.gov. You can also buy an additional $5,000 in paper I bonds using your tax refund with IRS Form 8888.

  • “I Bonds” bought between November 2022 and April 2023 will earn a 6.89% rate for the first six months. The rate of the subsequent 6-month period will be based on inflation again. More on Savings Bonds here.
  • In mid-April 2023, the CPI will be announced and you will have a short period where you will have a very close estimate of the rate for the next 12 months. I will have another post up at that time.
  • See below about EE Bonds as a potential long-term bond alternative.

Rewards checking accounts
These unique checking accounts pay above-average interest rates, but with unique risks. You have to jump through certain hoops which usually involve 10+ debit card purchases each cycle, a certain number of ACH/direct deposits, and/or a certain number of logins per month. If you make a mistake (or they judge that you did) you risk earning zero interest for that month. Some folks don’t mind the extra work and attention required, while others would rather not bother. Rates can also drop suddenly, leaving a “bait-and-switch” feeling.

  • Genisys Credit Union pays 5.25% APY on up to $7,500 if you make 10 debit card purchases of $5+ each, and opt into receive only online statements. Anyone can join this credit union via $5 membership fee to join partner organization.
  • Pelican State Credit Union pays 5.11% APY on up to $10,000 if you make 15 debit card purchases, opt into receive only online statements, and make at least 1 direct deposit, online bill payment, or automatic payment (ACH) per statement cycle. Anyone can join this credit union via partner organization membership.
  • The Bank of Denver pays 5.00% APY on up to $15,000 if you make 12 debit card purchases of $5+ each, receive only online statements, and make at least 1 ACH credit or debit transaction per statement cycle. Thanks to reader Bill for the updated info.
  • All America/Redneck Bank pays 4.50% APY on up to $15,000 if you make 10 debit card purchases each monthly cycle with online statements.
  • Presidential Bank pays 4.625% APY on balances between $500 and up to $25,000 (3.625% APY above that) if you maintain a $500+ direct deposit and at least 7 electronic withdrawals per month (ATM, POS, ACH and Billpay counts).
  • Find a locally-restricted rewards checking account at DepositAccounts.

Certificates of deposit (greater than 1 year)
CDs offer higher rates, but come with an early withdrawal penalty. By finding a bank CD with a reasonable early withdrawal penalty, you can enjoy higher rates but maintain access in a true emergency. Alternatively, consider building a CD ladder of different maturity lengths (ex. 1/2/3/4/5-years) such that you have access to part of the ladder each year, but your blended interest rate is higher than a savings account. When one CD matures, use that money to buy another 5-year CD to keep the ladder going. Some CDs also offer “add-ons” where you can deposit more funds if rates drop.

  • Credit Human has 24-month to 35-month CDs at 5.50% APY. $500 minimum to open. The early withdrawal penalty is 365 days of interest. Anyone can join this credit union via partner organization (no fee).
  • Sallie Mae Bank via SaveBetter has a 27-month CD at 4.85% APY. $1 minimum. Early withdrawal penalty is 180 days of simple interest.
  • Seattle Bank has a 5-year certificate at 4.70% APY ($1,000 min), 4-year at 4.65% APY, 3-year at 4.60% APY, 2-year at 4.55% APY, and 1-year at 4.50% APY. The early withdrawal penalty for the 5-year is a very reasonable 180 days of interest.
  • Lafayette Federal Credit Union has a 5-year certificate at 4.63% APY ($500 min), 4-year at 4.58% APY, 3-year at 4.52% APY, 2-year at 4.47% APY, and 1-year at 4.42% APY. They also have jumbo certificates with $100,000 minimums at even higher rates. The early withdrawal penalty for the 5-year is very high at 600 days of interest. Anyone can join this credit union via partner organization ($10 one-time fee).
  • You can buy certificates of deposit via the bond desks of Vanguard and Fidelity. You may need an account to see the rates. These “brokered CDs” offer FDIC insurance and easy laddering, but they don’t come with predictable early withdrawal penalties. Right now, I don’t see any competitive 5-year non-callable CDs. Be wary of higher rates from callable CDs, which means they can call back your CD if rates drop later.

Longer-term Instruments
I’d use these with caution due to increased interest rate risk, but I still track them to see the rest of the current yield curve.

  • Willing to lock up your money for 10 years? You can buy long-term certificates of deposit via the bond desks of Vanguard and Fidelity. These “brokered CDs” offer FDIC insurance, but they don’t come with predictable early withdrawal penalties. You might find something that pays more than your other brokerage cash and Treasury options. Right now, I see a 10-year CDs at (none available, non-callable) vs. 3.80% for a 10-year Treasury. Watch out for higher rates from callable CDs where they can call your CD back if interest rates drop.
  • How about two decades? Series EE Savings Bonds are not indexed to inflation, but they have a unique guarantee that the value will double in value in 20 years, which equals a guaranteed return of 3.5% a year. However, if you don’t hold for that long, you’ll be stuck with the normal rate, currently 2.10% for EE bonds issued November 1, 2022 to April 30, 2023. As of 3/6/23, the 20-year Treasury Bond rate was 4.14%.

All rates were checked as of 3/7/2023.

My Money Blog has partnered with CardRatings and may receive a commission from card issuers. Some or all of the card offers that appear on this site are from advertisers and may impact how and where card products appear on the site. MyMoneyBlog.com does not include all card companies or all available card offers. All opinions expressed are the author’s alone, and has not been provided nor approved by any of the companies mentioned.

MyMoneyBlog.com is also a member of the Amazon Associate Program, and if you click through to Amazon and make a purchase, I may earn a small commission. Thank you for your support.


Berkshire Hathaway 2022 Annual Shareholder Letter by Warren Buffett Notes

My Money Blog has partnered with CardRatings and may receive a commission from card issuers. Some or all of the card offers that appear on this site are from advertisers and may impact how and where card products appear on the site. MyMoneyBlog.com does not include all card companies or all available card offers. All opinions expressed are the author’s alone.

Berkshire Hathaway (BRK) released its 2022 Letter to Shareholders, which is how Warren Buffett updates his fellow shareholders annually on the status of the business. Direct ownership of Berkshire Hathaway shares was one of my first “self-directed” investments (above index fund holdings) for both educational and profit purposes. The reason that people like me always mention Warren Buffett is not because he is smart, but because he is an excellent teacher that cuts through the fog of complex subjects. He writes this letter with his sister in mind. This year’s letter is only 9 pages long, so I recommend reading it for yourself.

This year, the letter covered a lot of familiar ground. That’s the thing about investing and personal finance though, most of it is just sticking with a few simple yet critical ideas for years and years. Build the habit to act honorably and rationally every day, and keep avoiding risks where you can lose everything. Here are my personal highlights.

Berkshire shareholders are different.

We believe Berkshire’s individual holders largely to be of the once-a-saver, always-a-saver variety. Though these people live well, they eventually dispense most of their funds to philanthropic organizations. These, in turn, redistribute the funds by expenditures intended to improve the lives of a great many people who are unrelated to the original benefactor. Sometimes, the results have been spectacular.

Berkshire owns both businesses in their entirety and pieces through publicly-traded stock shares. They take the long-term view with both:

Our goal in both forms of ownership is to make meaningful investments in businesses with both long-lasting favorable economic characteristics and trustworthy managers. Please note particularly that we own publicly-traded stocks based on our expectations about their long-term business performance, not because we view them as vehicles for adroit purchases and sales. That point is crucial: Charlie and I are not stock-pickers; we are business-pickers.

As investors, don’t cut the flowers and water the weeds. Hold onto those flowers. This applies to index fund investing as well. If you buy the entire haystack, you are guaranteed to own the needles (flowers).

The lesson for investors: The weeds wither away in significance as the flowers bloom. Over time, it takes just a few winners to work wonders. And, yes, it helps to start early and live into your 90s as well.

The pillars: continuous saving, the power of compounding, avoiding catastrophic failures, and the American Tailwind.

Thus began our journey to 2023, a bumpy road involving a combination of continuous savings by our owners (that is, by their retaining earnings), the power of compounding, our avoidance of major mistakes and – most important of all – the American Tailwind. America would have done fine without Berkshire. The reverse is not true.

More on the importance of risk management and having skin in the game. What do you do? “I own a boatload of cash and a wide array of businesses.” Sounds perfect. 😁

As for the future, Berkshire will always hold a boatload of cash and U.S. Treasury bills along with a wide array of businesses. We will also avoid behavior that could result in any uncomfortable cash needs at inconvenient times, including financial panics and unprecedented insurance losses. Our CEO will always be the Chief Risk Officer – a task it is irresponsible to delegate. Additionally, our future CEOs will have a significant part of their net worth in Berkshire shares, bought with their own money.

Don’t count on Berkshire being broken apart or starting to distribute dividends anytime soon:

And yes, our shareholders will continue to save and prosper by retaining earnings.

At Berkshire, there will be no finish line.

The letter ends with a bunch of wise quotes from Charlie Munger. Here’s just one.

There is no such thing as a 100% sure thing when investing. Thus, the use of leverage is dangerous. A string of wonderful numbers times zero will always equal zero. Don’t count on getting rich twice.

Past shareholder letter notes.

The 2024 annual shareholder meeting will be in Omaha on Saturday, May 4th. CNBC will most likely livestream it again.

My Money Blog has partnered with CardRatings and may receive a commission from card issuers. Some or all of the card offers that appear on this site are from advertisers and may impact how and where card products appear on the site. MyMoneyBlog.com does not include all card companies or all available card offers. All opinions expressed are the author’s alone, and has not been provided nor approved by any of the companies mentioned.

MyMoneyBlog.com is also a member of the Amazon Associate Program, and if you click through to Amazon and make a purchase, I may earn a small commission. Thank you for your support.


Vanguard: 401(k) Balances Dropped by 20% in 2022, But Few Panicked

My Money Blog has partnered with CardRatings and may receive a commission from card issuers. Some or all of the card offers that appear on this site are from advertisers and may impact how and where card products appear on the site. MyMoneyBlog.com does not include all card companies or all available card offers. All opinions expressed are the author’s alone.

Vanguard has released some preview numbers from its 2023 America Saves report, which covers the nearly 5 million 401k, 403b, and other retirement plans that Vanguard administrates. More stats in this CNBC article.

Even though the average balance dropped by 20% in 2022, there wasn’t widespread panic or account changes. In fact, nearly 40% increased their deferral rate:

While average account balances decreased by 20% in 2022, primarily driven by negative market performance, participant behaviors mostly remained positive. Nearly 4 in 10 participants increased their deferral rate (either on their own or as part of an automatic annual increase), in line with previous years.

[…] And against a challenging market environment with increased volatility, only 6% of nonadvised participants traded, the lowest point in 20 years.

The table below goes into more detail. 50% of people kept their deferral rate the same, 24% of people allowed the auto-escalate feature to kick in, 15% manually increased their deferral rate, and 11% either manually decreased their deferral rate or set it to zero.

That means 89% of people kept their deferral rate the same or higher. 11% decreased. That 11% number is only a couple percentage points higher than in past years when the stock market went up.

My Money Blog has partnered with CardRatings and may receive a commission from card issuers. Some or all of the card offers that appear on this site are from advertisers and may impact how and where card products appear on the site. MyMoneyBlog.com does not include all card companies or all available card offers. All opinions expressed are the author’s alone, and has not been provided nor approved by any of the companies mentioned.

MyMoneyBlog.com is also a member of the Amazon Associate Program, and if you click through to Amazon and make a purchase, I may earn a small commission. Thank you for your support.