2023 Retirement and Benefit Account Contribution Limits: 401k, 403b, IRA, HSA, DCFSA

My Money Blog has partnered with CardRatings and may receive a commission from card issuers. Some or all of the card offers that appear on this site are from advertisers and may impact how and where card products appear on the site. MyMoneyBlog.com does not include all card companies or all available card offers. All opinions expressed are the author’s alone.

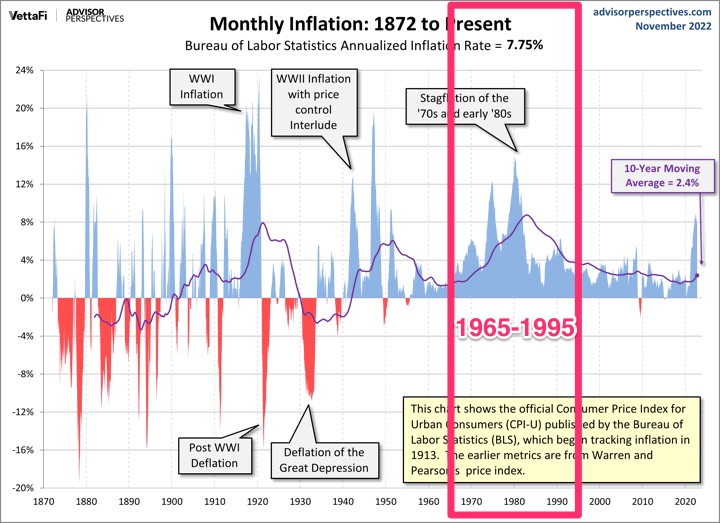
The beginning of the year is also a good time to check on the new annual contribution limits for retirement and benefit accounts, many of which are indexed to inflation. Our income has been quite variable these last few years, so I regularly adjust our paycheck deferral percentages based on expected income for the year. I still try to max things out if I can, or at least stay on pace to do so. This 2023 SHRM article has a nice summary of 2023 vs. 2022 numbers for most employer-based retirement and benefit accounts.

401k/403b Employer-Sponsored Accounts.

For example, I would break down the applicable limit down to monthly and bi-weekly amounts:

  • $22,500 annual limit = $1,875 per monthly paycheck.
  • $22,500 annual limit = $865.38 per bi-weekly paycheck.

The higher maximum limits are useful are for those folks that have the ability to contribute extra money into their 401k accounts on an after-tax basis (and then potentially perform an in-service Roth rollover), or those self-employed persons with SEP IRAs or Self-Employed 401k plans.

If you are contributing to a pre-tax account instead of a Roth, you could also use a paycheck calculator to find the detailed impact to your after-tax “take home” pay.

The investment options in 401k plans have also improved on average steadily over the years with lower fees and costs, allowing your money to compound even faster.

Traditional/Roth IRAs. The annual contribution limits are up $500 from last year, now $6,500 with an additional $1,000 allowed for those age 50+.

  • $6,500 annual limit = $541.67 per monthly paycheck.
  • $6,500 annual limit = $250 per bi-weekly paycheck.

Most brokerage accounts (Vanguard, Fidelity, M1 Finance) will allow you to set up automatic investments on a weekly, biweekly, or monthly basis. As long as you have enough money in your linked checking account, the broker will transfer the cash over and then invest it on a recurring basis. You may even be able to sync it to take out money the very same or next day as when your paycheck hits.

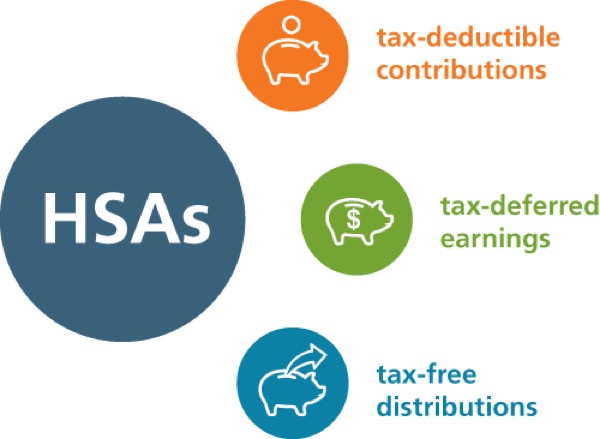
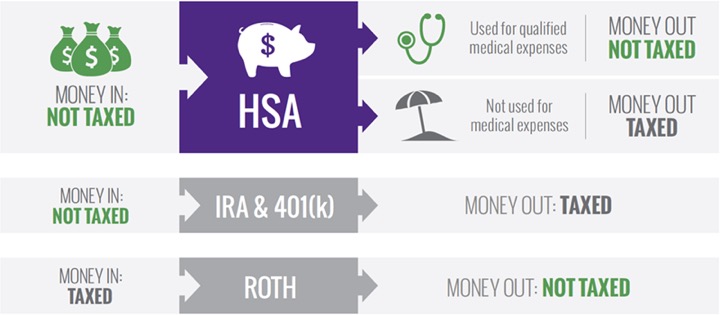
Health Savings Accounts are often treated as the equivalent of a “Healthcare IRA” due the potential triple tax benefits (tax-deduction on contributions, tax-deferred growth for decades, and tax-free withdrawals towards qualified healthcare expenses). This assumes that you have a high-deductible health insurance plan (more popular every year as they are cheaper for employers too), you can cover your current healthcare expenses out-of-pocket, and you can still afford to contribute to the HSA. Up a little for 2023.

Healthcare Flexible Spending Accounts are still an commonly-available option for others. Up a little for 2023.

Dependent Care FSAs are easy tax savings if you have children in daycare and/or preschool. These are not indexed to inflation.

Even if you aren’t hitting the limits, just increasing your salary deferral contribution rate 1% higher than last year can make a substantial difference if you keep it up. Simple evergreen advice. The easiest way for me not to eat potato chips is not the have them in the house. (Looking at you, Costco bag of Himalayan Salt Kettle Chips…) The easiest way to make sure you don’t spend the money that you want to invest, is to never have it touch your bank account.

My Money Blog has partnered with CardRatings and may receive a commission from card issuers. Some or all of the card offers that appear on this site are from advertisers and may impact how and where card products appear on the site. MyMoneyBlog.com does not include all card companies or all available card offers. All opinions expressed are the author’s alone, and has not been provided nor approved by any of the companies mentioned.

MyMoneyBlog.com is also a member of the Amazon Associate Program, and if you click through to Amazon and make a purchase, I may earn a small commission. Thank you for your support.


Portfolio Asset Class Returns, 2022 Year-End Review

My Money Blog has partnered with CardRatings and may receive a commission from card issuers. Some or all of the card offers that appear on this site are from advertisers and may impact how and where card products appear on the site. MyMoneyBlog.com does not include all card companies or all available card offers. All opinions expressed are the author’s alone.

yearendreview

Happy New Year! I enjoyed a little winter nap. This worked out fine as successful investing does not require constant attention. To be honest, if all my research and/or experience showed that lot of trading activity led to greater returns, I’d probably be happily trading away right now. But the opposite is closer to the truth, which means I have to make up rules to keep myself from unnecessary action. Here is the obligatory Warren Buffett quote:

Benign neglect, bordering on sloth, remains the hallmark of our investment process.

I used to login to look at my portfolio daily. Then I switched to tracking monthly returns on my low-cost index fund holdings across various asset classes. Now, I only rebalance with incoming cashflows based on my quarterly portfolio updates, and only check my official performance numbers and make major adjustments (selling something) at most once a year. Per Morningstar, here are the annual returns for select asset classes as benchmarked by popular ETFs after market close 12/30/22.

Commentary. Unlike years like 2020 and 2021 where nearly everything went up, 2022 was a year when nearly everything went down. Considering how high inflation was as well, there really was no place to hide.

The “set and forget” Vanguard Target Retirement 2055 fund (roughly 90% diversified stocks and 10% bonds) was down 17.5% in 2022, the biggest loss since the Financial Crisis in 2008. Still, if you have been a steady investor over the past several years, your average return over that span certainly isn’t horrible:

In my mind, this was one of those “inevitable” years. Sooner or later, all that money being pumped into the economy was going to lead to inflation. I had no idea it would be this year, but it was. As such, nobody can predict what 2023 will hold. I still like what I own overall. I just have to make sure our financial position allows us to survive any short-term panics in order to stay invested for the long-term.

My Money Blog has partnered with CardRatings and may receive a commission from card issuers. Some or all of the card offers that appear on this site are from advertisers and may impact how and where card products appear on the site. MyMoneyBlog.com does not include all card companies or all available card offers. All opinions expressed are the author’s alone, and has not been provided nor approved by any of the companies mentioned.

MyMoneyBlog.com is also a member of the Amazon Associate Program, and if you click through to Amazon and make a purchase, I may earn a small commission. Thank you for your support.


Lower Stock Valuations + Higher Interest Rates = Higher 3.8% Base Safe Withdrawal Rate

My Money Blog has partnered with CardRatings and may receive a commission from card issuers. Some or all of the card offers that appear on this site are from advertisers and may impact how and where card products appear on the site. MyMoneyBlog.com does not include all card companies or all available card offers. All opinions expressed are the author’s alone.

Investing for the long run is easier if you temper your emotions with the knowledge that lower stock and bond prices today suggest higher future returns (and vice versa). Morningstar has just released the 2022 edition of their research paper The State of Retirement Income (e-mail required, intro article), where they point out this silver lining:

Because equity valuations have declined and cash and bond yields have increased, the forward-looking prospects for portfolios—and in turn the amounts that new retirees can safely withdraw from those portfolios over a 30-year horizon—have enjoyed a nice lift since we explored the topic last year.

Whereas last year’s research suggested that a 3.3% withdrawal rate was a safe starting point for new retirees with balanced portfolios over a 30-year horizon, this year’s research points to 3.8% as a safe starting withdrawal percentage, with annual inflation adjustments to those withdrawals thereafter.

I haven’t processed the entire 29-page paper yet, but here’s a chart summarizing the differences between the future outlooks in 2021 and 2022. Quite a difference in only a year.

None of these numbers are guaranteed of course (in fact they are virtually guaranteed to be wrong), but step back and look and the big picture. Lower P/E ratios and a higher starting interest rate definitely provide a stronger investing base. You are buying businesses at a lower price and your bonds can again provide cushion now that interest rates have room to fall. As long as you are a buyer, this is a good thing.

My Money Blog has partnered with CardRatings and may receive a commission from card issuers. Some or all of the card offers that appear on this site are from advertisers and may impact how and where card products appear on the site. MyMoneyBlog.com does not include all card companies or all available card offers. All opinions expressed are the author’s alone, and has not been provided nor approved by any of the companies mentioned.

MyMoneyBlog.com is also a member of the Amazon Associate Program, and if you click through to Amazon and make a purchase, I may earn a small commission. Thank you for your support.


Fixed Index Annuities: What’s Behind “Market Upside with No Downside”?

My Money Blog has partnered with CardRatings and may receive a commission from card issuers. Some or all of the card offers that appear on this site are from advertisers and may impact how and where card products appear on the site. MyMoneyBlog.com does not include all card companies or all available card offers. All opinions expressed are the author’s alone.

My inbox has been seeing an uptick about structured products and fixed indexed annuities that offer “market-linked performance” or “market upside” with “downside protection”. While below is my usual take on these products, I wanted to provide some tools for your own due diligence.

via GIPHY

Any time you have some “magic box” that takes the stock market returns and advertises nearly the same high returns without the volatility and risk, you should know that there is no free lunch. You must pay a price.

The thing is, I might actually be okay with that. Insurance companies are in the risk transfer business. There should be some price at which I would pay for this downside protection. You offer me 90% of the stock market’s long-term return but I’ll never lose money? Sold. The problem is that (1) the actual cost is much higher than that and (2) never explicitly clear.

If the annuity industry was willing to strip away the obfuscation and opaque marketing, they could create a standardized product. For example, it might track the S&P 500 total return (no other index) but with a clear set of withdrawal penalties (surrender charges), annual fees, participation rates, etc. As a transparent and commoditized product, insurance companies would have to compete on price, like what we (somewhat miraculously) have with index funds and index ETFs.

Instead, every single fixed index annuity is different with 25 different variables and a complicated contracts with various ways that they can change many those variables in the future. “Point-to-point”. “Rate spreads”. A high “participation rate” will be advertised, but will only apply to custom “index” that was created last Tuesday but backtested to perfection. A 3% monthly cap or 10% annual cap on returns will be quietly added, knowing that the average buyer won’t know that history shows that cap lowers the overall average returns significantly. The “illustrations” will usually include 2001 and 2009. Oh, and they never include dividends from the index they track.

Now, a fellow personal finance writer was sued out of existence by an insurance company, so I will write this carefully. By the way, here are two current rate cards from two examples of popular products here and here. Notice the multitude of options, confusing terminology, and index names that sound kind of familiar but you really have no idea what’s inside.

Now, let’s say a fictional insurance company offers a 6-year fixed index annuity that tracks the S&P 500 index with a 65% participation rate. This is actually a very competitive rate. (Not any other random index. Always look for S&P 500.) Let’s assume straight-up direct crediting without annual or monthly maps.

The total average annual return of the S&P 500 index from 1926 to present (2022) with dividends reinvested is 10% annually. (Source.) So let’s just assume the stock market goes up by 10% a year. The higher the S&P 500 returns, the more this annuity will lag, so we’ll just go with average.

Every single fixed index annuity I’ve ever seen excludes dividends. If you remove dividends, the historical S&P 500 index price-only return is only about 6.1%. Does the average person on the street know this? Is this fact included in the annuity free steak dinner pitch? 🤥

This is a huge deal! Here’s a comparison of $1 invested in the S&P 500 in 1930 with and without dividends. Yes, the final numbers are ~$200 vs. ~$6,000. (Source: S&P.)

Even for shorter periods, the compounding effect of removing dividends is significant:

We haven’t even multiplied by the participation rate of 65% yet, after which you are only left with 4%. You’ve now gone all the way from 10% annual return to only 4%. You could also reach this number by using an average total return of 8% and dividend yield of 2%. You’d still end up with 4% (take the 6% price-only return and multiply by 0.65).

But wait, my principal is protected, so it’s worth it! That just means your minimum return is 0% if the stock market does poorly. But 0% is not the proper comparison point.

The true downside is the guaranteed rates that you are giving up! For example, today you can find a 6-year plain-vanilla MYGA fixed annuity paying 5.40% guaranteed. At 5.40% annually guaranteed, in MYGA worst-case scenario $100,000 will become over $137,000 after 6 years. Meanwhile, the fixed index annuity might only give you… $100,000.

MYGAs are commoditized annuities that compete based on price (and safety rating) and offer the same tax-deferral possibilities. Since they compete on price, they also pay lower sales commissions than fixed index annuities. Would you want to buy something that would pay 4% if long-term averages hold (0% minimum), or 5.4% guaranteed (5.4% minimum)? MYGAs aren’t perfect either, but at least I can explain how any MYGA works very easily.

This is a simple hypothetical illustration to help you realize the high price you might be paying for “upside potential with principal protection”. I understand the desire to avoid market volatility, but there may be cheaper and more transparent ways to get there. My main issue is not that the price is high, it’s that the price is nearly impossible to pin down due to intentional complexity. If we could see price tags, we could comparison shop!

My Money Blog has partnered with CardRatings and may receive a commission from card issuers. Some or all of the card offers that appear on this site are from advertisers and may impact how and where card products appear on the site. MyMoneyBlog.com does not include all card companies or all available card offers. All opinions expressed are the author’s alone, and has not been provided nor approved by any of the companies mentioned.

MyMoneyBlog.com is also a member of the Amazon Associate Program, and if you click through to Amazon and make a purchase, I may earn a small commission. Thank you for your support.


Retirement Income and Inflation: 30-Year TIPS Ladder vs. SPIA Annuity + Excess Account

My Money Blog has partnered with CardRatings and may receive a commission from card issuers. Some or all of the card offers that appear on this site are from advertisers and may impact how and where card products appear on the site. MyMoneyBlog.com does not include all card companies or all available card offers. All opinions expressed are the author’s alone.

This is inadvertently turning into a multi-part series, mostly revolving about taking advantage of long-term TIPS to build guaranteed inflation-adjusted income. Are the current real TIPS yields worthy of locking in? The previous parts:

Following up on the Gerstein article from that last post, a final chart that was interesting compared the cumulative income from a low start that adjusts with inflation and a higher start that stays fixed. Starting with a $1 million portfolio, consider two simple theoretical scenarios. First, a 4% initial withdrawal rate ($40,000 in Year 1) that adjusts upward to keep up with 4% steady annual inflation. Second, a fixed annuity-style payment of $70,000 a year. Here’s how that plays out:

In such a scenario, their chart shows that the total cumulative income paid out would even out around year 27.

I was happy to see that William Bernstein – highly respected in index investing circles but relatively spare with words these days – wrote a new article Playing Inflation Russian Roulette in Retirement with a lot of good nuggets. He compares the retirement income from a single-premium immediate annuity and a 30-year TIPS ladder.

The comparison gets a bit complicated (see article to fully explain chart below), but I did take away the idea that even if you start with $70,000 annuity income like in the above scenario, you only spend $40,000 and put excess ($30,000 in year 1) rest aside in a “for future inflation” side account. You can still increase your $40,000 a year of spending annually, but keep putting the difference into the excess side account. This excess amount will decrease over time until the inflation-adjusted spending reaches and surpasses $70,000 a year, at which time you start withdrawing from the excess side account. In addition, we should consider the money left over in case of early death.

In the end, Bernstein seems to lean towards the TIPS ladder as he points out the danger of high inflation. He reminds us that “worst-case historically” doesn’t actually mean “worst-case”. How many times recently have we read the words “biggest [something] ever”?

One is reminded of Nassim Taleb’s dictum that “this so-called worst-case event, when it happened, exceeded the worst case at the time.” In other words, 5.4% long-term inflation is nowhere near the worst-case scenario. Even a casual glance at the global history of fiat money in the twentieth century shows that hyperinflation is the rule, not the exception. During the above-mentioned 1966-1995 period, U.S. debt/GDP averaged around 50%; now, it’s more twice that level and rising rapidly, and given the hundreds of trillions of dollars of additional implicit debt (promises to Social Security and Medicare, and to backstop future emergencies – think military aid to Ukraine and weather or terrorism disaster relief) it won’t take much to tip things over into a debt spiral, especially if the Treasury has to roll its debt over at higher interest rates for very long.

He also reminds us that we don’t have to do either one – the easiest way for most of us to access additional inflation-adjusted income is to delay taking Social Security:

It would be nice if one could purchase inflation-adjusted annuities, but those products have gone the way of disco, and I suspect that proposing their revival would not be a career enhancing move for any insurance company executive who suggests it. The best that one can do in this regard is to “purchase” the inflation-adjusted annuity offered by spending down one’s retirement assets to defer Social Security until age 70.

Finally, I wanted to include his relatively-conservative views on safe withdrawal rates:

The single most important factor that determines how to do that is the nest-egg burn rate (your annual spending divided by the size of your retirement portfolio). I suggest the following rule of thumb: if your burn rate is below 2% at age 60, below 3% at age 70, or below 4% at age 80, a standard stock/bond portfolio will nicely see you through your retirement, and you have no need to annuitize your assets.

I plan to keep an eye on real TIPS yields, and may readjust within the bond portion of my portfolio to purchase individual TIPS at longer maturities.

My Money Blog has partnered with CardRatings and may receive a commission from card issuers. Some or all of the card offers that appear on this site are from advertisers and may impact how and where card products appear on the site. MyMoneyBlog.com does not include all card companies or all available card offers. All opinions expressed are the author’s alone, and has not been provided nor approved by any of the companies mentioned.

MyMoneyBlog.com is also a member of the Amazon Associate Program, and if you click through to Amazon and make a purchase, I may earn a small commission. Thank you for your support.


Robinhood IRA: 1% Bonus Match on Retirement Contributions

My Money Blog has partnered with CardRatings and may receive a commission from card issuers. Some or all of the card offers that appear on this site are from advertisers and may impact how and where card products appear on the site. MyMoneyBlog.com does not include all card companies or all available card offers. All opinions expressed are the author’s alone.

I have to hand it to Robinhood, they are good at marketing. It took years, but Robinhood is finally offering Individual Retirement Accounts (IRAs) with the unique feature of giving you an extra 1% on every dollar you contribute, every year. Traditional and Roth IRAs are available. The 2022 IRA contribution limits are $6,000 ($7,000 if you are age 50+), which means a bonus of up to $60-$70 annually. Right now, you have to sign up on their waitlist, with actual rollout in January 2023. If you wait until then, you could do both your 2022 and 2023 contributions in early 2023.

Some important items after reading through their IRA Match FAQ:

  • Make sure you make your IRA contributions from a linked external bank account only up to the annual IRA contribution limits. Contributions from your Robinhood brokerage or spending accounts don’t earn the IRA Match. Rollovers don’t count either.
  • You must keep the funds that earned the match in the account for at least 5 years to avoid the possibility of a clawback fee when withdrawn.
  • IRA Match counts as interest income in your IRA and doesn’t count toward your annual IRA contribution limit.
  • Outgoing $100 ACAT transfer fee applies if you transfer to another broker later using Automated Customer Account Transfer Service. This fee is currently set at $100.

I’m a little conflicted about this. On the one hand, IRA contributions are so limited and precious, it would be nice to effectively put in a little extra and have it grow tax deferred for 20-30 years, even if it is only about $60 a year. On the other hand, IRAs have more paperwork requirements and I don’t know if I trust Robinhood’s barebones customer service to properly deal with my annual “Backdoor” IRA conversions and such.

My Money Blog has partnered with CardRatings and may receive a commission from card issuers. Some or all of the card offers that appear on this site are from advertisers and may impact how and where card products appear on the site. MyMoneyBlog.com does not include all card companies or all available card offers. All opinions expressed are the author’s alone, and has not been provided nor approved by any of the companies mentioned.

MyMoneyBlog.com is also a member of the Amazon Associate Program, and if you click through to Amazon and make a purchase, I may earn a small commission. Thank you for your support.


Sustainable Portfolio Withdrawal Rates During High-Inflation Periods

My Money Blog has partnered with CardRatings and may receive a commission from card issuers. Some or all of the card offers that appear on this site are from advertisers and may impact how and where card products appear on the site. MyMoneyBlog.com does not include all card companies or all available card offers. All opinions expressed are the author’s alone.

As a follow-up to my previous post on historical inflation (10-year rolling averages), how do periods of high inflation affect safe withdrawal rates for retirement portfolios? I reference a paper about Sustainable Portfolio Withdrawal Rates During High-Inflation Periods by Gerstein Fisher research, but in the middle of writing this post the source document and the entire GersteinFisher.com domain went down. (Update: Here it is on the Wayback Machine. Thanks to reader Peter for the link.)

Planning for the future with 50% stocks and 50% bonds is tricky! The chart below shows how widely a portfolio’s value can vary depending on your start date. The model portfolio is 50% broad US stocks and 50% US bonds. Here’s what $1,000,000 starting in 1929 vs. 1961 vs. 1975 would have performed with a 4% withdrawal rate and 3% annual inflation:

In Exhibit 3, we can see the vast difference a starting year can make, comparing the portfolio values over time of a portfolio where we assume a 4% withdrawal rate and 3% annual inflation but begin in three very different periods. In the worst case, retirement begins in 1929, on the eve of the Great Depression; in 1961, retirement begins in an “average” period with moderate market returns; and in 1975, we have a 30-year period of exceptionally good returns overall, fueled by falling interest rates and by missing the 2008-2009 Global Financial Crisis.

These may be extremes, but they are extremes that happened to real people and could certain happen again.

A difference of 1% withdrawal rate can be huge over a 30 year retirement. Here’s the difference between a 3% initial withdrawal rate (then adjusted upwards with inflation) and a 4% initial withdrawal rate (then adjusted upwards with inflation) during a period that contained high inflation (1965-1995). Starting out at withdrawing $30,000 a year on a $1,000,000 portfolio would have been just fine, but withdrawing $40,000 a year would have been disastrous.

To examine what a “worst case scenario” regarding inflation might look like, we examine one of the highest inflation periods in modern US history – a retirement starting in 1966 and ending in 1995, which experienced multiple years of double-digit inflation in the mid- to late-1970s. Even a 4% initial withdrawal rate isn’t sustainable given the rapid increase in inflation (the portfolio is expected to meet an annual withdrawal of nearly $200,000 by the end of the 30-year period), exhausting the portfolio in roughly 25 years.

Here’s the 1965-1995 period highlighted from the historical inflation chart. I noticed that the inflation wasn’t sky-high the entire time, but it was elevated over a long-enough period.

The main takeaway from the paper was that the 4% rule does work most of the time, but watch out for periods of high inflation. Don’t blindly take out 4% a year when inflation is high and your portfolio performance is low. The 4% rule may be something like 95% effective historically, but being flexible with your withdrawals will prevent complete disaster even if you are in the bad luck 5%.

My Money Blog has partnered with CardRatings and may receive a commission from card issuers. Some or all of the card offers that appear on this site are from advertisers and may impact how and where card products appear on the site. MyMoneyBlog.com does not include all card companies or all available card offers. All opinions expressed are the author’s alone, and has not been provided nor approved by any of the companies mentioned.

MyMoneyBlog.com is also a member of the Amazon Associate Program, and if you click through to Amazon and make a purchase, I may earn a small commission. Thank you for your support.


Best Interest Rates on Cash – December 2022 Update

My Money Blog has partnered with CardRatings and may receive a commission from card issuers. Some or all of the card offers that appear on this site are from advertisers and may impact how and where card products appear on the site. MyMoneyBlog.com does not include all card companies or all available card offers. All opinions expressed are the author’s alone.

Here’s my monthly roundup of the best interest rates on cash as of December 2022, roughly sorted from shortest to longest maturities. We all need some safe assets for cash reserves or portfolio stability, and there are often lesser-known opportunities available to individual investors. Check out my Ultimate Rate-Chaser Calculator to see how much extra interest you’d earn by moving money between accounts. Rates listed are available to everyone nationwide. Rates checked as of 12/4/2022.

TL;DR: 5% on up to $10,000 from fintech. 5% APY on up to $100k via a 7-month promo CD. 4% APY available on liquid savings. 1-year CD at 4.71% APY. 5-year CD at 4.75% APY. Compare against Treasury bills and bonds at every maturity (12-month near 4.69%). 6.89% Savings I Bonds still available if you haven’t maxed out 2022 limits.

Fintech accounts
Available only to individual investors, fintech companies often pay higher-than-market rates in order to achieve fast short-term growth (often using venture capital). “Fintech” is usually a software layer on top of a partner bank’s FDIC insurance.

  • 5% on up to $10,000. Juno now pays 5% on all cash deposits up to $10,000 and 3% on cash deposits from $10,001 up to $250,000. $50 direct deposit bonus. Please see my Juno review for details.
  • 4.00% APY on $6,000 with no direct deposit requirement. Current offers 4% APY on up to $6,000 total ($2,000 each on three savings pods). No direct deposit required. $50 referral bonus for new members with $200+ direct deposit with promo code JENNIFEP185. Please see my Current app review for details.
  • 4.00% APY on up to $250,000, but requires direct deposit and credit card spend. Currently a waitlist for new applicants. The top tier requires you to maintain positive cashflow in the checking account each month, $500 in total monthly direct deposits, and $500 in credit card purchases each month. Existing customers will get up to 4% APY through April 2023, with requirements waived through March 2023. Please see my updated HM Bradley review for details.

High-yield savings accounts
Since the huge megabanks STILL pay essentially no interest, I think every should have a separate, no-fee online savings account to accompany your existing checking account. The interest rates on savings accounts can drop at any time, so I list the top rates as well as competitive rates from banks with a history of competitive rates. Some banks will bait you with a temporary top rate and then lower the rates in the hopes that you are too lazy to leave.

  • The leapfrogging to be the temporary “top” rate continues. All America/Redneck Bank is at 4% APY for balances up to $75,000 ($500 to open, no min balance). Republic Bank of Chicago has a Digital Money Market account at 4.00% APY ($2,500 minimum to open and avoid monthly fee, new money only).
  • SoFi Bank is now up to 3.25% APY + up to $275 new account bonus with direct deposit. You must maintain a direct deposit of any amount each month for the higher APY. SoFi has their own bank charter now so no longer a fintech by my definition. See details at $25 + $250 SoFi Money new account and deposit bonus.
  • There are several other established high-yield savings accounts that aren’t a top rate, but historically do keep it relatively competitive for those that don’t want to keep switching banks.

Short-term guaranteed rates (1 year and under)
A common question is what to do with a big pile of cash that you’re waiting to deploy shortly (plan to buy a house soon, just sold your house, just sold your business, legal settlement, inheritance). My usual advice is to keep things simple and take your time. If not a savings account, then put it in a flexible short-term CD under the FDIC limits until you have a plan.

  • No Penalty CDs offer a fixed interest rate that can never go down, but you can still take out your money (once) without any fees if you want to use it elsewhere. CIT Bank has a 11-month No Penalty CD at 3.65% APY with a $1,000 minimum deposit. Ally Bank has a 11-month No Penalty CD at 3.30% APY for all balance tiers. Marcus has a 13-month No Penalty CD at 3.05% APY with a $500 minimum deposit. You may wish to open multiple CDs in smaller increments for more flexibility.
  • My eBanc has a 12-month certificate at 4.71% APY. $5,000 minimum. Early withdrawal penalty is 90 days of interest.
  • Andrews FCU has a special 7-month certificate at 5.00% APY (offer ends 12/14). $1,000 min, $100k max. Anyone can join this credit union with a ACC membership, and ACC membership is free with promo code “Andrews”. My previous application experience.

Money market mutual funds + Ultra-short bond ETFs*
Many brokerage firms that pay out very little interest on their default cash sweep funds (and keep the difference for themselves). * Money market mutual funds are regulated, but ultimately not FDIC-insured, so I would still stick with highly reputable firms. I am including a few ultra-short bond ETFs as they may be your best cash alternative in a brokerage account, but they may experience short-term losses.

  • Vanguard Federal Money Market Fund is the default sweep option for Vanguard brokerage accounts, which has an SEC yield of 3.70%. Odds are this is much higher than your own broker’s default cash sweep interest rate.
  • Vanguard Ultra-Short-Term Bond Fund currently pays 4.32% SEC yield ($3,000 min) and 4.42% SEC Yield ($50,000 min). The average duration is ~1 year, so there is some term interest rate risk.
  • The PIMCO Enhanced Short Maturity Active Bond ETF (MINT) has a 4.21% SEC yield and the iShares Short Maturity Bond ETF (NEAR) has a 4.31% SEC yield while holding a portfolio of investment-grade bonds with an average duration of ~6 months.

Treasury Bills and Ultra-short Treasury ETFs
Another option is to buy individual Treasury bills which come in a variety of maturities from 4-weeks to 52-weeks and are fully backed by the US government. You can also invest in ETFs that hold a rotating basket of short-term Treasury Bills for you, while charging a small management fee for doing so. T-bill interest is exempt from state and local income taxes.

  • You can build your own T-Bill ladder at TreasuryDirect.gov or via a brokerage account with a bond desk like Vanguard and Fidelity. Here are the current Treasury Bill rates. As of 12/2/2022, a new 4-week T-Bill had the equivalent of 3.81% annualized interest and a 52-week T-Bill had the equivalent of 4.69% annualized interest.
  • The iShares 0-3 Month Treasury Bond ETF (SGOV) has a 3.52% SEC yield and effective duration of 0.10 years. SPDR Bloomberg Barclays 1-3 Month T-Bill ETF (BIL) has a 3.47% SEC yield and effective duration of 0.08 years.

US Savings Bonds
Series I Savings Bonds offer rates that are linked to inflation and backed by the US government. You must hold them for at least a year. If you redeem them within 5 years there is a penalty of the last 3 months of interest. The annual purchase limit for electronic I bonds is $10,000 per Social Security Number, available online at TreasuryDirect.gov. You can also buy an additional $5,000 in paper I bonds using your tax refund with IRS Form 8888.

  • “I Bonds” bought between November 2022 and April 2023 will earn a 6.89% rate for the first six months. The rate of the subsequent 6-month period will be based on inflation again. More on Savings Bonds here.
  • In mid-April 2023, the CPI will be announced and you will have a short period where you will have a very close estimate of the rate for the next 12 months. I will have another post up at that time.
  • See below about EE Bonds as a potential long-term bond alternative.

Prepaid Cards with Attached Savings Accounts
A small subset of prepaid debit cards have an “attached” FDIC-insured savings account with exceptionally high interest rates. The negatives are that balances are severely capped, and there are many fees that you must be careful to avoid (lest they eat up your interest). There is a long list of previous offers that have already disappeared with little notice. I don’t personally recommend nor use any of these anymore, as I feel the work required and the fees charged if you mess up exceeds any small potential benefit.

  • Mango Money pays 6% APY on up to $2,500, if you manage to jump through several hoops. Requirements include $1,500+ in “signature” purchases and a minimum balance of $25.00 at the end of the month.
  • NetSpend Prepaid pays 5% APY on up to $1,000 but be warned that there is also a $5.95 monthly maintenance fee if you don’t maintain regular monthly activity.

Rewards checking accounts
These unique checking accounts pay above-average interest rates, but with unique risks. You have to jump through certain hoops which usually involve 10+ debit card purchases each cycle, a certain number of ACH/direct deposits, and/or a certain number of logins per month. If you make a mistake (or they judge that you did) you risk earning zero interest for that month. Some folks don’t mind the extra work and attention required, while others would rather not bother. Rates can also drop suddenly, leaving a “bait-and-switch” feeling.

  • All America/Redneck Bank pays 4.25% APY on up to $15,000 if you make 10 debit card purchases each monthly cycle with online statements.
  • The Bank of Denver pays 4.00% APY on up to $15,000 if you make 12 debit card purchases of $5+ each, receive only online statements, and make at least 1 ACH credit or debit transaction per statement cycle. Thanks to reader Bill for the updated info.
  • Presidential Bank pays 3.75% APY on balances between $500 and up to $25,000 (3.00% APY above that) if you maintain a $500+ direct deposit and at least 7 electronic withdrawals per month (ATM, POS, ACH and Billpay counts).
  • Find a locally-restricted rewards checking account at DepositAccounts.

Certificates of deposit (greater than 1 year)
CDs offer higher rates, but come with an early withdrawal penalty. By finding a bank CD with a reasonable early withdrawal penalty, you can enjoy higher rates but maintain access in a true emergency. Alternatively, consider building a CD ladder of different maturity lengths (ex. 1/2/3/4/5-years) such that you have access to part of the ladder each year, but your blended interest rate is higher than a savings account. When one CD matures, use that money to buy another 5-year CD to keep the ladder going. Some CDs also offer “add-ons” where you can deposit more funds if rates drop.

  • Bread Financial has a 5-year certificate at 4.75% APY ($1,500 min), 4-year at 4.65% APY, 3-year at 4.50% APY, 2-year at 4.50% APY, and 1-year at 4.50% APY. The early withdrawal penalty for the 5-year is 365 days of interest.
  • Department Of Commerce Federal Credit Union has a 5-year certificate at 4.70% APY ($500 min), 4-year at 4.59% APY, 3-year at 4.57% APY, 2-year at 4.61% APY, and 1-year at 4.40% APY. The early withdrawal penalty for the 5-year is 180 days of interest. Anyone can join this credit union through a $5 membership in the American Consumer Council (ACC). Enter ACC membership number on the online application.
  • You can buy certificates of deposit via the bond desks of Vanguard and Fidelity. You may need an account to see the rates. These “brokered CDs” offer FDIC insurance and easy laddering, but they don’t come with predictable early withdrawal penalties. Right now, I see a 5-year CD at 4.85% (non-callable). Be wary of higher rates from callable CDs, which means they can call back your CD if rates drop later.

Longer-term Instruments
I’d use these with caution due to increased interest rate risk, but I still track them to see the rest of the current yield curve.

  • Willing to lock up your money for 10 years? You can buy long-term certificates of deposit via the bond desks of Vanguard and Fidelity. These “brokered CDs” offer FDIC insurance, but they don’t come with predictable early withdrawal penalties. You might find something that pays more than your other brokerage cash and Treasury options. Right now, I see a 10-year CDs at 5.25% (non-callable) vs. 3.56% for a 10-year Treasury. Watch out for higher rates from callable CDs where they can call your CD back if interest rates drop.
  • How about two decades? Series EE Savings Bonds are not indexed to inflation, but they have a unique guarantee that the value will double in value in 20 years, which equals a guaranteed return of 3.5% a year. However, if you don’t hold for that long, you’ll be stuck with the normal rate currently 2.10%. As of 12/2/2022, the 20-year Treasury Bond rate was 3.79%.

All rates were checked as of 12/4/2022.

My Money Blog has partnered with CardRatings and may receive a commission from card issuers. Some or all of the card offers that appear on this site are from advertisers and may impact how and where card products appear on the site. MyMoneyBlog.com does not include all card companies or all available card offers. All opinions expressed are the author’s alone, and has not been provided nor approved by any of the companies mentioned.

MyMoneyBlog.com is also a member of the Amazon Associate Program, and if you click through to Amazon and make a purchase, I may earn a small commission. Thank you for your support.


Historical Inflation Chart: 10-Year Rolling Average 1872-2022

My Money Blog has partnered with CardRatings and may receive a commission from card issuers. Some or all of the card offers that appear on this site are from advertisers and may impact how and where card products appear on the site. MyMoneyBlog.com does not include all card companies or all available card offers. All opinions expressed are the author’s alone.

Advisor Perspectives has a nice chart of 150 years of historical inflation (1872-2022). I appreciate that it includes both the short-term monthly inflation numbers as well as the 10-year rolling average over this long period of time.

A few basic observations:

  • From a long-term perspective, there have been many large sharp spikes in inflation throughout the entire period. Inflation has been a persistently recurring concern.
  • From roughly 1872-1940, there were extreme swings between both high inflation and high deflation. Of course, this was also when the dollar was (mostly) on the gold standard.
  • From roughly 1950 onward, the rolling 10-year average for inflation has still varied from ~2% to ~9% annually. Given our current low 10-year average, inflation could continue to be elevated for many years and not look out of place on this chart.

My primary takeaway is to always stay mindful of long-term inflation risk. I don’t know what inflation will be next month or next year, but I am confident that it’s coming sooner or later. Some applications (my opinion):

  • The 30-year fixed rate mortgage continues to be a great inflation hedge. (Even at high interest rates, that might soon result in lower prices.) As long as you lock in a monthly payment that you can comfortably afford and plan to stay a while, your monthly mortgage payment will only effectively get cheaper over time as inflation eats away at it. If rates drop, you can refinance. If rates rise, you can keep it forever and even rent the property out if you move, as high rates means inflation likely boosted rents while your mortgage payment stayed the same.
  • On the flip side, according to Macrotrends, the a 30-year Treasury bond yielded only 1% a year back in 2020. Long-term nominal bonds became a popular portfolio diversifier while rates were dropping (performance chasing), but in reality they became a ticking inflation bomb. I’m still avoiding long-term nominal bonds today.
  • A lifetime annuity has definite upsides, but inflation will eat away at the spending power over what could be 30 years. Maybe you’ll get older and spend less each year anyway, but I’d still maintain other assets (like stocks) to hedge that inflation risk. I like single premium immediate annuities as a possible tool for retirement income, but not as the only or primary tool.
  • TIPS are complex yet intriguing. I’m still not sure what the best play is right now, but I am happy to keep holding them as part of my bond portfolio. I’m leaning towards moving away from ETFs and more towards a ladder of individual bonds, especially if the real rates on long-term TIPS go any higher.
My Money Blog has partnered with CardRatings and may receive a commission from card issuers. Some or all of the card offers that appear on this site are from advertisers and may impact how and where card products appear on the site. MyMoneyBlog.com does not include all card companies or all available card offers. All opinions expressed are the author’s alone, and has not been provided nor approved by any of the companies mentioned.

MyMoneyBlog.com is also a member of the Amazon Associate Program, and if you click through to Amazon and make a purchase, I may earn a small commission. Thank you for your support.


The Best Health Savings Accounts (HSA) Providers: Fidelity and Lively/Schwab

My Money Blog has partnered with CardRatings and may receive a commission from card issuers. Some or all of the card offers that appear on this site are from advertisers and may impact how and where card products appear on the site. MyMoneyBlog.com does not include all card companies or all available card offers. All opinions expressed are the author’s alone.

Updated for 2022. It’s open enrollment season, and there is better than a 50/50 chance that you will enroll in a high-deductible health plan. That means that you are also eligible to contribute to a Health Savings Account (HSA), which has triple-tax-free benefits: tax-deductible contributions, tax-free earnings growth, and tax-free withdrawals when used for qualified medical expenses (image source). This makes them better than even Traditional and Roth IRAs (image source).

Are you an HSA spender or HSA investor? As a spender, you contribute to the HSA, grab the tax-deduction, and then treat it like a piggy bank and spend it down whenever you have a qualified healthcare expense. You don’t have that annoying “use-it-or-lose-it” feature of Flexible Spending Accounts (FSA), and most offer FDIC insurance on your cash.

As an investor, you are trying to maximize the tax benefits of HSAs by contributing as much as possible, investing in growth assets like stocks, and then avoiding withdrawals until retirement. If you have the financial means, you would max out the contribution limits ($3,850 for individual and $7,300 for family coverage in 2022, slightly more if age 55+) and then pay for your healthcare expenses out-of-pocket instead of withdrawing from the HSA. You should keep a “forever” digital PDF copy of all your healthcare expenses. Technically, you can still withdraw the amounts of all those expenses tax-free at any time in the future, even decades later.

You can pick your own HSA provider, and some are much worse than others! Morningstar has updated their 2022 Health Savings Account landscape report (e-mail required). After reading through the entire thing, my take is that you really only need to consider the two best HSA plans: Fidelity HSA and Lively HSA.

Similar to IRAs, you don’t need to use the default provider that your employer recommends. As long as you are covered by an HSA-eligible health plan on the first of the month, you can open an account with any provider. From the Lively site:

My health insurance or employer is offering an HSA. Do I need to go with the option they provide?

No. Because an HSA is an individual account, you are free to choose whichever HSA provider you want to work with (e.g., Lively).

Source: “Publication 969 (2018), Health Savings Accounts and Other Tax-Favored Health Plans.”

In addition, you can transfer the balance in an existing HSA to another HSA provider at any time, even if no longer covered by an HSA-eligible health plan.

Fidelity and Lively HSA for spenders. Both have the least fees and a safe place for your cash. Others HSAs have maintenance fees, minimum balance requirements, and more “annoyance” fees.

  • No minimum balances.
  • No maintenance fees.
  • No paper statement fees.
  • No account closing fee.
  • FDIC-insured cash balances.

Fidelity offers the best potential interest rate on cash via the Fidelity® Government Cash Reserves money market fund (FDRXX) as a core position, which currently pays more than their FDIC cash sweep option. Note that this money market fund is very conservative but is not FDIC-insured.

Fidelity and Lively HSA for investors. Both feature a low-cost way to invest your contributions for long-term growth:

  • No minimum balance required in spending account in order to invest.
  • Offers access to all core asset classes.
  • Offers free self-directed access to ETFs, individual stocks, bonds, and mutual funds.
  • Offers “guided portfolios” for automated investing.

Fidelity quietly offers the institutional shares of their Fidelity Freedom Index “target date” mutual fund line-up with a very low expense ratio of ~0.08%. It’s a bit confusing as you must choose the self-directed “Fidelity HSA” option to access this auto-pilot fund. The self-directed option has no annual fee and also includes access to ETFs, individual stocks, bonds, and mutual funds. Be aware that the Fidelity HSA sign-up page may try to steer you towards the different “Fidelity Go HSA” for guided investing, but that robo-advisor charges an annual advisory fee of 0.35% per year for balances of $25,000 and above (no advisory fee while your balance is under $25,000).

Lively also has similar “guided portfolio” robo-advisor option that charges a 0.50% annual advisory fee. Morningstar dinged Lively for this, but Lively also offers a self-directed brokerage window with Schwab. That means you can invest in any ETF with zero commissions at Schwab including building your own DIY portfolio using index ETFs, mutual funds, individuals stocks, or individual bonds. (Previously TD Ameritrade, but Schwab bought TD Ameritrade.) The Schwab brokerage option has no annual fee with a $3,000 minimum balance, otherwise if you are under $3,000 it costs $24 a year. If you already have your own financial advisor connected to Schwab, you can allow them to manage your HSA as well.

A simple Vanguard ETF portfolio might be 50% US Stocks (VTI), 30% International Stocks (VXUS), 20% US Bonds (BND). The total weighted expense ratio of such a portfolio would be less than 0.05% annually and fully customizable for the DIY investor. Both accounts can cost basically nothing above the expense ratio of the cheapest ETFs you can find – you really can’t ask for more than that!

Fidelity and Lively have the least amount of extra and/or hidden fees:

How do Fidelity and Lively make money then? Your employer has to pay a fee to HSA providers. It’s still much cheaper for them than your old full-price health insurance premium, of course.

Bottom line. Both Fidelity HSA and Lively HSA are excellent options for your Health Savings Account funds. If you want auto-pilot investing, the cheapest option is the Fidelity Freedom Index Institutional shares. Alternatively, Lively is an independent HSA provider with a modern feel and a good history of customer-friendly fee practices and service. DIY investors can use the Lively/Schwab brokerage window to invest in a mix of Vanguard or other index ETFs.

(Disclosures: I am not an affiliate of Fidelity, although I would if they had such a program. I am an affiliate of Lively and may receive a commission if you open an account through my link. Thanks for your support of this site.)

My Money Blog has partnered with CardRatings and may receive a commission from card issuers. Some or all of the card offers that appear on this site are from advertisers and may impact how and where card products appear on the site. MyMoneyBlog.com does not include all card companies or all available card offers. All opinions expressed are the author’s alone, and has not been provided nor approved by any of the companies mentioned.

MyMoneyBlog.com is also a member of the Amazon Associate Program, and if you click through to Amazon and make a purchase, I may earn a small commission. Thank you for your support.


Stockholm Banco vs. FTX: Creating Money From Nothing in 1661 vs. 2022

My Money Blog has partnered with CardRatings and may receive a commission from card issuers. Some or all of the card offers that appear on this site are from advertisers and may impact how and where card products appear on the site. MyMoneyBlog.com does not include all card companies or all available card offers. All opinions expressed are the author’s alone.

As with the rest of the finance world, I’ve been following the collapse of FTX and Sam Bankman-Fried (SBF). There are many explainers (Matt Levine is my fav, but paywall?), while new details keep emerging. Crypto the newborn currency is growing up and finding out the hard way why traditional finance has all the rules it has. Central bank? FDIC insurance? Independently-audited financials? A board of directors? Not being allowed to buy personal houses with company money and having other expenses approved with emojis? 💸 From the most recent bankruptcy filing and written by the new FTX CEO of less than a week:

Never in my career have I seen such a complete failure of corporate controls and such a complete absence of trustworthy financial information as occurred here. From compromised systems integrity and faulty regulatory oversight abroad, to the concentration of control in the hands of a very small group of inexperienced, unsophisticated and potentially compromised individuals, this situation is unprecedented.

As a fitting follow-up to the idea of timeless financial wisdom, Doomberg (also paywall) brings us historical perspective from Stockholm Banco, which in 1661 was the first European bank to print banknotes. I found this detailed history of Stockholm Banco [pdf] on the website of Sveriges Riksbank. A single person was granted great and unsupervised power to effectively create unlimited currency. What could go wrong?

In 1656, Johan Palmstruch was finally granted the country’s first bank charter by the King of Sweden after multiple rejections. (His proposal only succeeded after he promised half the profits to the Crown.) At the time, people had to use cumbersome copper and silver currency (see above) that fluctuated in value based on industrial demand for those metals. The slab of copper above was “10 dalers” and the size of two sheets of letter paper and weighed 43 pounds!

It was the inconvenience of copper plate money that the exchange bank would remedy. Institutions and the general public could deposit their plate money in the bank in exchange for a receipt, which could then be used in transactions with other parties. This was a great relief for commerce. In the bank charter, Karl X Gustav emphasised ‘the good convenience our subjects thereby obtain, that in this way they are rid of much subtraction and addition, hauling and dragging and other trouble that the copper coin entails in its handling’. The weighty plates boded well for the success of the exchange bank.

A simple piece of paper could now represent any amount of dalers (100 daler note below):

The charter allowed the creation of an exchange bank. People could deposit their slabs of copper and silver at the bank, and instead receive a paper note promising that it could be redeemed back again at any time. Convenient! The charter also allowed the creation of a loan bank. The bank lent out money, and charged interest. The exchange bank and the loan bank were supposed to be separate. But look at all those pretty deposits just sitting there!

The charters treated the exchange bank and the loan bank as separate entities but this was not observed in practice. Although the exchange bank was no more than a depository for its clients’ money, which could be withdrawn without notice, the Bank started to lend its holdings. This state of affairs continued until 1664.

Soon the deposits were all lent out. But people still wanted loans! There was money to be made! If only there was a way to keep the whole things spinning…

Palmstruch found a solution. According to Erik Appelgren, a bank commissioner, ‘Not long afterwards, credit notes became a supplement invented by Herr Director for the shortage of money’. The bank would issue notes declaring that the holder had a claim on Stockholms Banco for a specified sum of money; the Bank would redeem the notes in exchange for cash. […]

This was a novelty in European banking. Earlier attempts to introduce notes had invariably tied them to deposits. Such certificates of deposit could be transferred as a token of value to business associates, who in turn could pass them on in the same way. In contrast, Palmstruch’s notes were not backed by particular deposits; instead, they relied on public confidence that the Bank would redeem them on demand. The system relied on the Bank’s credibility.

Success! Print as much money as you want! Expansion! Even the Crown and other high-ranking officials borrowed money.

Thanks to the credit notes, lending by the Bank ceased to be dependent on deposits. Loans could be provided for as much as the Bank was prepared to issue notes. After a tentative start, the flood gates were opened during 1663. The Crown borrowed 500,000 d km, Chancellor De la Gardie took a total of 255,000 d km for himself, the tar company borrowed 200,000 d km. More and more loans were unsecured. The business flourished; branches were opened in Abo, Falun and Goteborg; in Skane (ceded to Sweden by Denmark in 1658) the three upper Estates requested a separate branch in either Malmo or Landskrona.

What if… something spooked the customers… and people actually wanted all their deposits back?

However, reality soon caught up. On 12 September 1663, Joachim Schuttehielm, a bank secretary, reported to Palmstruch, who was away in Vasteras, that so much money had been withdrawn that the Bank had less than 4,000 d km in ready cash. To make matters worse, a depositor had announced that he wished to withdraw 10,000 d km. Schuttehielm asked Palmstruch to send money as soon as he could but the Director had nothing to send.

The bank collapsed after only six years. During the cleanup, audits revealed tons of missing money. Palmstruch was sentenced first to execution (later reduced to jail), and died only a year after his eventual release.

The Court of Appeal was not impressed. On 22 July 1668 Palmstruch was dismissed as director and sentenced to the loss of his privileges. He was banished for life and ordered to compensate within six months for ‘all the deficiency and shortage in the Bank that can demonstrably be proven’. If he failed to pay what he owed, he would be executed.

Let’s compare to the current FTX situation. Started out with a simple idea and got out of control very fast. FTX is less than 4 years old. Everyone was easily distracted by getting rich, all greased by the political donations and naming rights that spread the money around and the “effective altruism” that the media loved. The power to create unlimited currency for a while – FTX claimed billions of SRM and FTT tokens as assets – essentially things that FTX made out of thin air and knew it. Eventually, the desperate loaning out (aka stealing) of $10 billion in customer deposits to help themselves out of a jam. The panicked discovery. The coming criminal proceedings.

Individual investors are again reminded why FDIC and NCUA insurance exists – counterparty risk is real. It doesn’t matter what you own if you let the wrong place hold it for you.

My Money Blog has partnered with CardRatings and may receive a commission from card issuers. Some or all of the card offers that appear on this site are from advertisers and may impact how and where card products appear on the site. MyMoneyBlog.com does not include all card companies or all available card offers. All opinions expressed are the author’s alone, and has not been provided nor approved by any of the companies mentioned.

MyMoneyBlog.com is also a member of the Amazon Associate Program, and if you click through to Amazon and make a purchase, I may earn a small commission. Thank you for your support.


Contemporary Art vs. S&P 500: Paul Allen’s $1.6 Billion Art Sale

My Money Blog has partnered with CardRatings and may receive a commission from card issuers. Some or all of the card offers that appear on this site are from advertisers and may impact how and where card products appear on the site. MyMoneyBlog.com does not include all card companies or all available card offers. All opinions expressed are the author’s alone.

The trend in many alternative asset classes is to make previously illiquid and high-value investments like art, collectibles, farmland, and music royalties more accessible to us common folk by offering fractional ownership. From the comfort of my smartphone, I can buy a $250 fractional share of a Shelby Mustang and hope to sell my equivalent of a turn signal stalk at a tidy profit in the future.

Masterworks does this for art, letting you invest as little as $500 into multi-million dollar works of art by artists like Basquiat, Picasso, and Banksy. The pitch is pretty direct:

Contemporary art has outperformed the S&P for the past 25 years, but there has been no way to invest in it. Masterworks is the first company to offer investment products within the art market.

The Masterworks website claims that the Contemporary Art asset class has returned 13.8% annualized from 1995-2021, much more than the 10.2% from the S&P 500. This data “reflects value-weighted price appreciation for all Contemporary Art (works produced after 1945) sold at least twice at public auction.”

In addition, this chart from a 2022 Citi Art Market report shows that Contemporary Art had a very low or even slightly negative historical correlation with stocks (Developed Equities, -0.04) and bonds (Investment Grade Fixed Income, 0.15).

Here’s what Citi says about future art prices:

Citi Private Bank’s proprietary strategic asset allocation methodology does not address art. We instead approach art primarily from the collector perspective of the clients whom we serve rather than strictly as an investment. In any case, art does not lend itself to an objective cash flow-based analysis as equities, fixed income, and real estate do. In this regard, it has more in common with commodities. As such, rigorous estimates of future long-term returns are not possible.

Alright, how about some more data points then? Recently, the estate of Paul Allen sold off a record-breaking $1.6 billion of art, most of which was also both bought and sold at a public auction. This gives us both the purchase and sell prices and the ability to calculate annualized return. This Axios article included an analysis and created the chart below.

Some sales are impressive, like a Cézanne that was bought for ~$38 million and sold for ~$138 million less than 20 years later. A cool $100 million profit ain’t too shabby. However, once you calculate the overall return including the holding periods, the annualized return was only 6.2% annualized over an average holding period of 18 years. Axios notes that the S&P 500 grew at 8.9% annualized over the past 18 years, which allows them to drop this zinger:

The bottom line: Allen would have made more money just buying an S&P 500 index fund.

I can see art as as an asset class having positive long-term returns in the future, and I can see it having a relatively low correlation to stocks, but I suppose that I have a hard time seeing it return something amazing and consistently better than the S&P 500. Especially for any basket of specific pieces, it may return 4% more than the S&P 500 annually, or it may return 4% less than the S&P 500 annually. This would be more of a fun, amusing thing – “I own a flower petal from that Monet!” – that might retain permanent value in the future.

(I can’t tell a Stella from a Seurat, so I have no personal investment in Masterworks.)

My Money Blog has partnered with CardRatings and may receive a commission from card issuers. Some or all of the card offers that appear on this site are from advertisers and may impact how and where card products appear on the site. MyMoneyBlog.com does not include all card companies or all available card offers. All opinions expressed are the author’s alone, and has not been provided nor approved by any of the companies mentioned.

MyMoneyBlog.com is also a member of the Amazon Associate Program, and if you click through to Amazon and make a purchase, I may earn a small commission. Thank you for your support.