How Do Your 401(k) Stats Compare? Vanguard How America Saves 2022

My Money Blog has partnered with CardRatings and may receive a commission from card issuers. Some or all of the card offers that appear on this site are from advertisers and may impact how and where card products appear on the site. MyMoneyBlog.com does not include all card companies or all available card offers. All opinions expressed are the author’s alone.

Vanguard recently released the 2022 edition of their annual How America Saves report, a 110-page report targeted at industry insiders which looks at the nearly 5 million 401k, 403b, and other defined-contribution retirement plans. If you wish to geek out on 401k stats, there is a great deal of information in this report. Here are a few highlights based on 2021 data:

Employee contributions. The average/median employee contribution rate amongst participants was 7.3%/6.1% in 2021. Median means that half of people were saving more, while half were saving less. Average is weighted more by absolute dollar savings. (Click to enlarge.)

Employer contributions (company match). The total average/median contributions by year was 11.2%/10.3% (employer and employee combined). This means that the average/median employer/company contribution was about 4%. (Click to enlarge.)

How much does Vanguard think we should be saving? I found this quote noteworthy:

We believe participants need to reach a total saving rate of 12% to 15% or more to meet their retirement goals.

Maxing it out! Overall, 14% of participants saved the maximum annual amount of $19,500 ($26,000 age 50+) for 2021. However, 58% of those with incomes of $150,000+ maxed out their contributions. Here is the full breakdown by income:

(Not really sure how the folks earning under $15k per year are doing it… maybe these income numbers are after subtracting the contributions?)

How are people investing? Asset allocation. This chart shows the trends in asset allocation as the participants age. The increased use of Target-date funds and other professional management options has changed it so that young people are less likely to hold cash. (Click to enlarge.)

Account balances. The average account balance was $141,542 for 2021; the median balance was $35,345. This disparity means that a small number of plans with very high balances skews this often-quoted average upward. (Click to enlarge.)

I don’t pay much attention to this stat because the average includes workers across different age groups, income levels, job tenures, and so on. If I just switched jobs and rolled over my old 401k into an IRA, technically my balance is zero no matter what.

My Money Blog has partnered with CardRatings and may receive a commission from card issuers. Some or all of the card offers that appear on this site are from advertisers and may impact how and where card products appear on the site. MyMoneyBlog.com does not include all card companies or all available card offers. All opinions expressed are the author’s alone, and has not been provided nor approved by any of the companies mentioned.

MyMoneyBlog.com is also a member of the Amazon Associate Program, and if you click through to Amazon and make a purchase, I may earn a small commission. Thank you for your support.


Retirement Income Green vs. Red Zones from Jim Otar

My Money Blog has partnered with CardRatings and may receive a commission from card issuers. Some or all of the card offers that appear on this site are from advertisers and may impact how and where card products appear on the site. MyMoneyBlog.com does not include all card companies or all available card offers. All opinions expressed are the author’s alone.

Jim Otar is a retired engineer-turned-financial-planner who has written many books and articles about retirement income. I recently found an old bookmark and reread his article Lifetime Retirement Income: The Zone Strategy from RetirementOptimizer.com. One core principle of his retirement advice that you don’t plan using averages:

The averages don’t cut it. For proper retirement planning, you must base your retirement solutions and strategies on adverse outcomes and not average outcomes.

For example, you don’t plan for average life expectancy. You plan for reaching age 95 for both you and your spouse/partner if applicable.

Green Zone: You have enough money that you can simply live off a balanced portfolio of stocks and bonds, even if returns are on the unlucky side of history and much lower than average. Here are the numbers for his calculated sustainable withdrawal rate until age 95:

For example, if you are 65 years old and need $40,000 of annual income from your portfolio (above Social Security and other income sources), then you would need a portfolio balance of $40,000 divided by 3.8% = $1,052,631. (Alternatively, multiply $40,000 by 26.3.) If you have more than this, you are in the green zone. You’ll have enough money even after a market run that is bad historically, and you’ll probably end up leaving a decent estate or be able to spend more later on.

Red Zone: You need guaranteed income. You don’t have enough to live off of a portfolio of stocks without a decent chance of running completely out of money. The most prudent advice is to buy annuities that will provide a guaranteed level of income and stretch your limited assets for the rest of your lifetime, no matter how long that is.

The advice is then to use your money to buy a single premium immediate life annuity with payments that are indexed to inflation (CPI). At the time of writing, such an inflation-indexed SPIA would pay more that the sustainable rate above. The effective “safe withdrawal rate” for the same 65-year-old above would be 4.5% to 4.9%. Unfortunately, this article was written back in 2007 and as of 2022 there are zero insurance companies that offer inflation-indexed immediate annuities.

However, the same overall concept still applies. The Red Zone means you need to take critical action. You should see how much guaranteed lifetime income you can receive from a single premium immediate annuity (SPIA), perhaps with an escalation rider that increases your payout 1%-3% every year. You will need to consider reducing expenses somehow (downsize home, relocate to lower cost-of-living area). You may need to find additional income (keep working, rent out property). You might need to do all three.

Grey Zone used to mean that you were between the 3.8% withdrawal rate of the Green Zone and the 4.5% withdrawal rate of the Red Zone. Today, I assume it simply means you are close to green, but not quite. You should take some of those Red Zone actions listed above.

I found the Green/Grey/Red Zone concept to be an interesting retirement planning framework to consider. If you don’t have enough, you shouldn’t just wing it with stocks and hope for the best. SPIAs can help you stretch your money for a more secure retirement. I believe that SPIAs aren’t discussed enough in personal finance, and if there were more demand, perhaps the competition would create better and higher-yielding SPIA products. The problem is that non-transparent products like indexed annuities that promise things like “market-linked returns with no downside risk” are both better sellers and offer higher commissions to most insurance salespeople.

My Money Blog has partnered with CardRatings and may receive a commission from card issuers. Some or all of the card offers that appear on this site are from advertisers and may impact how and where card products appear on the site. MyMoneyBlog.com does not include all card companies or all available card offers. All opinions expressed are the author’s alone, and has not been provided nor approved by any of the companies mentioned.

MyMoneyBlog.com is also a member of the Amazon Associate Program, and if you click through to Amazon and make a purchase, I may earn a small commission. Thank you for your support.


Maxing Out the 401k Company Match: How Many Actually Do It?

My Money Blog has partnered with CardRatings and may receive a commission from card issuers. Some or all of the card offers that appear on this site are from advertisers and may impact how and where card products appear on the site. MyMoneyBlog.com does not include all card companies or all available card offers. All opinions expressed are the author’s alone.

At the top of many personal finance “To-do Lists” is to max out the employer match offered in your 401k/403b retirement plan. It’s usually the first “savings” step after paying down high-interest debt and keeping up with your bills. Here’s a screenshot from the Standardized Personal Finance Advice Flowchart via Reddit:

And here it is again from JP Morgan Asset Management, right after building up an emergency fund:

I’ve read this advice so many times, but how many people even complete this Top 3 item on the list? To be clear, this is just contributing enough to maximize your employer match contribution, not maxing out your allowable employee contribution. (That’s on the list of standardized advice as well, but at a slightly lower priority level.)

Vanguard recently released its How America Saves 2022 report with tons of data about the retirement accounts that they help manage. Let’s see what they found.

First of all, what does it take to max out your 401k company match? Roughly a 6% contribution rate over the years.

So… how many people actually max out their 401k company match? Roughly 70% of participants contributed at least the max match rate in 2021. For participants in plan with an auto-increase feature, this number goes up to 77% overall after three years.

If you aren’t at least maxing out the company match and getting your “free money”, hopefully this stat provides some peer pressure. Over 2/3rds are doing it! You don’t want to be below-average, do you?? 😱

My Money Blog has partnered with CardRatings and may receive a commission from card issuers. Some or all of the card offers that appear on this site are from advertisers and may impact how and where card products appear on the site. MyMoneyBlog.com does not include all card companies or all available card offers. All opinions expressed are the author’s alone, and has not been provided nor approved by any of the companies mentioned.

MyMoneyBlog.com is also a member of the Amazon Associate Program, and if you click through to Amazon and make a purchase, I may earn a small commission. Thank you for your support.


Best Interest Rates on Cash – August 2022 Update

My Money Blog has partnered with CardRatings and may receive a commission from card issuers. Some or all of the card offers that appear on this site are from advertisers and may impact how and where card products appear on the site. MyMoneyBlog.com does not include all card companies or all available card offers. All opinions expressed are the author’s alone.

Here’s my monthly roundup of the best interest rates on cash as of August 2022, roughly sorted from shortest to longest maturities. We all need some safe assets for cash reserves or portfolio stability, and there are often lesser-known opportunities available to individual investors. Check out my Ultimate Rate-Chaser Calculator to see how much extra interest you’d earn by moving money between accounts. Rates listed are available to everyone nationwide. Rates checked as of 8/2/2022.

TL;DR: 4% APY on up to $6,000 for liquid savings at Current with no direct deposit requirement. MyBankingDirect 2.20% APY liquid savings. 1-year CD 3% APY. 5-year CD 3.65% APY. Compare against Treasury bills and bonds at every maturity. 9.62% Savings I Bonds still available if you haven’t done it yet.

Fintech accounts
Available only to individual investors, fintech companies often pay higher-than-market rates in order to achieve fast short-term growth (often using venture capital). “Fintech” is usually a software layer on top of a partner bank’s FDIC insurance.

  • 4% APY on $6,000. Current offers 4% APY on up to $6,000 total ($2,000 each on three savings pods). No direct deposit required. $50 referral bonus for new members with $200+ direct deposit with promo code JENNIFEP185. Please see my Current app review for details.
  • 3% APY on up to $100,000, but requires direct deposit and credit card spend. HM Bradley pays up to 3% APY if you open both a checking and credit card with them, and maintain $1,500 in total direct deposit each month and make $100 in credit card purchases each month. Please see my updated HM Bradley review for details.

High-yield savings accounts
Since the huge megabanks pay essentially no interest, I think every should have a separate, no-fee online savings account to accompany your existing checking account. The interest rates on savings accounts can drop at any time, so I list the top rates as well as competitive rates from banks with a history of competitive rates. Some banks will bait you with a temporary top rate and then lower the rates in the hopes that you are too lazy to leave.

  • MyBankingDirect is up to 2.20% APY with no minimum balance requirements ($500 minimum to open).
  • SoFi is now offering 1.80% APY + up to $325 new account bonus with direct deposit. You must maintain a direct deposit each month of any amount for the higher APY. SoFi now has their own bank charter so no longer a fintech by my definition. See details at $25 + $300 SoFi Money new account and deposit bonus.
  • There are several other established high-yield savings accounts at closer to 1.50% APY. Marcus by Goldman Sachs is on that list, and if you open a new account with a Marcus referral link (from reader Paul) you now can get an extra 1.00% APY for your first 3 months.

Short-term guaranteed rates (1 year and under)
A common question is what to do with a big pile of cash that you’re waiting to deploy shortly (plan to buy a house soon, just sold your house, just sold your business, legal settlement, inheritance). My usual advice is to keep things simple and take your time. If not a savings account, then put it in a flexible short-term CD under the FDIC limits until you have a plan.

  • No Penalty CDs offer a fixed interest rate that can never go down, but you can still take out your money (once) without any fees if you want to use it elsewhere. CIT Bank has a 11-month No Penalty CD at 2.00% APY with a $1,000 minimum deposit. Ally Bank has a 11-month No Penalty CD at 1.40% APY for all balance tiers. Marcus has a 13-month No Penalty CD at 1.55% APY with a $500 minimum deposit. You may wish to open multiple CDs in smaller increments for more flexibility.
  • Bread Financial has a 12-month certificate at 3.00% APY. Early withdrawal penalty is 180 days of interest.

Money market mutual funds + Ultra-short bond ETFs*
Many brokerage firms that pay out very little interest on their default cash sweep funds (and keep the difference for themselves). * Money market mutual funds are regulated, but ultimately not FDIC-insured, so I would still stick with highly reputable firms. I am including a few ultra-short bond ETFs as they may be your best cash alternative in a brokerage account, but they may experience short-term losses.

  • Vanguard Federal Money Market Fund is the default sweep option for Vanguard brokerage accounts, which has an SEC yield of 1.92%. Compare with the Fidelity Government Money Market Fund (SPAXX), Fido’s sweep option which charges a higher expense ratio and thus only offers a 1.42% SEC yield.
  • Vanguard Ultra-Short-Term Bond Fund currently pays 2.40% SEC yield ($3,000 min) and 2.50% SEC Yield ($50,000 min). The average duration is ~1 year, so your principal may vary a little bit.
  • The PIMCO Enhanced Short Maturity Active Bond ETF (MINT) has a 2.37% SEC yield and the iShares Short Maturity Bond ETF (NEAR) has a 2.55% SEC yield while holding a portfolio of investment-grade bonds with an average duration of ~6 months.

Treasury Bills and Ultra-short Treasury ETFs
Another option is to buy individual Treasury bills which come in a variety of maturities from 4-weeks to 52-weeks and are fully backed by the US government. You can also invest in ETFs that hold a rotating basket of short-term Treasury Bills for you, while charging a small management fee for doing so. T-bill interest is exempt from state and local income taxes.

  • You can build your own T-Bill ladder at TreasuryDirect.gov or via a brokerage account with a bond desk like Vanguard and Fidelity. Here are the current Treasury Bill rates. As of 8/2/2022, a new 4-week T-Bill had the equivalent of 2.18% annualized interest and a 52-week T-Bill had the equivalent of 3.09% annualized interest.
  • The Goldman Sachs Access Treasury 0-1 Year ETF (GBIL) has a 1.38% SEC yield and the SPDR Bloomberg Barclays 1-3 Month T-Bill ETF (BIL) has a 1.18% SEC yield. GBIL appears to have a slightly longer average maturity than BIL.

US Savings Bonds
Series I Savings Bonds offer rates that are linked to inflation and backed by the US government. You must hold them for at least a year. If you redeem them within 5 years there is a penalty of the last 3 months of interest. The annual purchase limit for electronic I bonds is $10,000 per Social Security Number, available online at TreasuryDirect.gov. You can also buy an additional $5,000 in paper I bonds using your tax refund with IRS Form 8888.

  • “I Bonds” bought between May 2022 and October 2022 will earn a 9.62% rate for the first six months. The rate of the subsequent 6-month period will be based on inflation again. More on Savings Bonds here.
  • In mid-October 2022, the CPI will be announced and you will have a short period where you will have a very close estimate of the rate for the next 12 months. I will have another post up at that time.
  • See below about EE Bonds as a potential long-term bond alternative.

Prepaid Cards with Attached Savings Accounts
A small subset of prepaid debit cards have an “attached” FDIC-insured savings account with exceptionally high interest rates. The negatives are that balances are severely capped, and there are many fees that you must be careful to avoid (lest they eat up your interest). There is a long list of previous offers that have already disappeared with little notice. I don’t personally recommend nor use any of these anymore, as I feel the work required and the fees charged if you mess up exceeds any small potential benefit.

  • Mango Money pays 6% APY on up to $2,500, if you manage to jump through several hoops. Requirements include $1,500+ in “signature” purchases and a minimum balance of $25.00 at the end of the month.
  • NetSpend Prepaid pays 5% APY on up to $1,000 but be warned that there is also a $5.95 monthly maintenance fee if you don’t maintain regular monthly activity.

Rewards checking accounts
These unique checking accounts pay above-average interest rates, but with unique risks. You have to jump through certain hoops which usually involve 10+ debit card purchases each cycle, a certain number of ACH/direct deposits, and/or a certain number of logins per month. If you make a mistake (or they judge that you did) you risk earning zero interest for that month. Some folks don’t mind the extra work and attention required, while others would rather not bother. Rates can also drop suddenly, leaving a “bait-and-switch” feeling.

  • Porte fintech app requires a one-time direct deposit of $1,000+ to open a savings account. Porte then requires $3,000 in direct deposits and 15 debit card purchases per quarter (average $1,000 direct deposit and 5 debit purchases per month) to receive 3% APY on up to $15,000. New customer bonus via referral.
  • The Bank of Denver pays 2.00% APY on up to $10,000 if you make 12 debit card purchases of $5+ each, receive only online statements, and make at least 1 ACH credit or debit transaction per statement cycle. If you meet those qualifications, you can also link a Kasasa savings account that pays 1.00% APY on up to $25k. Thanks to reader Bill for the updated info.
  • Presidential Bank pays 2.25% APY on balances between $500 and up to $25,000, if you maintain a $500+ direct deposit and at least 7 electronic withdrawals per month (ATM, POS, ACH and Billpay counts).
  • Evansville Teachers Federal Credit Union (soon Liberty FCU) pays 3.30% APY on up to $20,000. You’ll need at least 15 debit transactions and other requirements every month.
  • Lake Michigan Credit Union pays 3.00% APY on up to $15,000. You’ll need at least 10 debit transactions and other requirements every month.
  • (I’ve had a poor customer service experience with this CU, but the rate is still good.) Lafayette Federal Credit Union is offering 2.02% APY on balances up to $25,000 with a $500 minimum monthly direct deposit to their checking account. No debit transaction requirement. They are also offering new members a $100 bonus with certain requirements. Anyone can join this credit union via partner organization ($10 one-time fee).
  • Find a locally-restricted rewards checking account at DepositAccounts.

Certificates of deposit (greater than 1 year)
CDs offer higher rates, but come with an early withdrawal penalty. By finding a bank CD with a reasonable early withdrawal penalty, you can enjoy higher rates but maintain access in a true emergency. Alternatively, consider building a CD ladder of different maturity lengths (ex. 1/2/3/4/5-years) such that you have access to part of the ladder each year, but your blended interest rate is higher than a savings account. When one CD matures, use that money to buy another 5-year CD to keep the ladder going. Some CDs also offer “add-ons” where you can deposit more funds if rates drop.

  • CFG Bank has a 5-year certificate at 3.65% APY ($500 min), 3-year at 3.55% APY, and 1-year at 2.75% APY. The early withdrawal penalty for the 5-year is 180 days of interest.
  • You can buy certificates of deposit via the bond desks of Vanguard and Fidelity. You may need an account to see the rates. These “brokered CDs” offer FDIC insurance and easy laddering, but they don’t come with predictable early withdrawal penalties. Right now, I see a 5-year CD at 3.55% APY. Be wary of higher rates from callable CDs listed by Fidelity.

Longer-term Instruments
I’d use these with caution due to increased interest rate risk, but I still track them to see the rest of the current yield curve.

  • Willing to lock up your money for 10 years? You can buy long-term certificates of deposit via the bond desks of Vanguard and Fidelity. These “brokered CDs” offer FDIC insurance, but they don’t come with predictable early withdrawal penalties. You might find something that pays more than your other brokerage cash and Treasury options. Right now, I don’t see any 10-year CDs available vs. 2.76% for a 10-year Treasury. Watch out for higher rates from callable CDs where they can call your CD back if interest rates rise.
  • How about two decades? Series EE Savings Bonds are not indexed to inflation, but they have a unique guarantee that the value will double in value in 20 years, which equals a guaranteed return of 3.5% a year. However, if you don’t hold for that long, you’ll be stuck with the normal rate which is quite low (currently 0.10%). I view this as a huge early withdrawal penalty. But if holding for 20 years isn’t an issue, it can also serve as a hedge against prolonged deflation during that time. Purchase limit is $10,000 each calendar year for each Social Security Number. As of 7/5/2022, the 20-year Treasury Bond rate was 3.22%.

All rates were checked as of 8/2/2022.

My Money Blog has partnered with CardRatings and may receive a commission from card issuers. Some or all of the card offers that appear on this site are from advertisers and may impact how and where card products appear on the site. MyMoneyBlog.com does not include all card companies or all available card offers. All opinions expressed are the author’s alone, and has not been provided nor approved by any of the companies mentioned.

MyMoneyBlog.com is also a member of the Amazon Associate Program, and if you click through to Amazon and make a purchase, I may earn a small commission. Thank you for your support.


JP Morgan Self-Directed Brokerage: Up to $625 New Deposit/Transfer Bonus

My Money Blog has partnered with CardRatings and may receive a commission from card issuers. Some or all of the card offers that appear on this site are from advertisers and may impact how and where card products appear on the site. MyMoneyBlog.com does not include all card companies or all available card offers. All opinions expressed are the author’s alone.

Brokerage firms constantly compete for “assets under management”, and many are willing to give you cash to move over your existing portfolio from your existing broker over to them. If you are unsatisfied with your current broker, these incentives may help you find a new home for your hard-earned assets.

Chase started a self-directed brokerage arm called “Chase You Invest”, but I guess that didn’t sound fancy enough, because now it is called JP Morgan Self-Directed Investing (a part of JP Morgan Wealth Management). They are currently offering up to $625 for new accounts, depending the value of assets that you move over (deposit cash or move over stocks and securities):

  • $125 with $25,000-$99,999 in qualifying new money.
  • $300 with $100,000–$249,999 in qualifying new money
  • $625 with $250,000+ in qualifying new money

Here are the steps:

  1. Open a J.P. Morgan Self-Directed Investing account through this page by 10/10/2022. (General Investment Taxable, Traditional IRA, or Roth IRA.)
  2. Transfer – You have 45 days to fund your account with qualifying new money (cannot be existing deposits, funds or securities held by you at JP Morgan, Chase or affiliate partners). Your bonus will be determined on day 45.
  3. Earn

The features for the account itself seem like most other online brokerages. Unlimited commission-free online stock, ETF and options trades (+ $0.65 per-contract fee). You can trade ETFs, fixed income, mutual funds, and options. The interface is more on the basic side, but you can perform instant funds transfers between the brokerage account and your Chase checking account, which may be convenient.

Here is their fee schedule. A few things I noticed: Buying a treasury at auction costs $50. IRA Maintenance fee of $75 per year. IRA Termination fee of $95 per account.

Here is more fine print:

You can only participate in one J.P. Morgan Self-Directed Investing new money bonus in a 12 month period from the last bonus coupon enrollment date. Coupon is good for one time use and only one bonus per account. Account types and other restrictions apply. Offer terms are subject to change and/or termination without advance notice. The value of the cash award may be considered income, and we may be required to send you, and file with the IRS, a Form 1099-MISC (“Miscellaneous Information”), or a Form 1042-S (“Foreign Person’s U.S. Source Income Subject to Withholding”) if applicable.

The $125 bonus is best in terms of percentage (0.5% of $25,000), but in terms of time/effort you may just want to get the biggest bonus. There have been somewhat higher bonuses in the past from Chase/JP Morgan, but it’s unknown if they will come back.

Given that we are now in a higher interest rate environment, you should take into account the potential lost interest if you deposit idle cash into their default sweep account. You might also consider ultra-short bond ETFs like MINT or Treasury Bill ETFs like GBIL (still possible to lose value).

Usually, the easiest thing is to perform an in-kind ACAT transfer of existing securities, which takes less than a week and all of your tax basis information should also move over after another few days. Your old broker may charge you an outgoing ACAT fee about about $75, although you should ask JP Morgan if they will reimburse you for this fee.

My Money Blog has partnered with CardRatings and may receive a commission from card issuers. Some or all of the card offers that appear on this site are from advertisers and may impact how and where card products appear on the site. MyMoneyBlog.com does not include all card companies or all available card offers. All opinions expressed are the author’s alone, and has not been provided nor approved by any of the companies mentioned.

MyMoneyBlog.com is also a member of the Amazon Associate Program, and if you click through to Amazon and make a purchase, I may earn a small commission. Thank you for your support.


S&P 500 Bear Market Time to Recovery? Average vs. Worst-Case Scenario

My Money Blog has partnered with CardRatings and may receive a commission from card issuers. Some or all of the card offers that appear on this site are from advertisers and may impact how and where card products appear on the site. MyMoneyBlog.com does not include all card companies or all available card offers. All opinions expressed are the author’s alone.

How long will this bear market last? What is the longest that the S&P 500 index number we always see on TV (which doesn’t include dividends) stayed below its initial value? Here is an interesting chart “Probability of a lower S&P 500 by number of years invested” via @GRDecter:

The text below the chart is a bit small, but it reads:

The longer you stay invested, the lower the probability that you lose money. There has been no 14-year or longer period when the S&P 500 has declined in value, and that is even before counting dividends.

While that suggests this chart supports the idea of owning stocks long-term, it is also an important education for managing expectations; This information might actually make stock ownership worse than you initially thought. If you asked the average stock investor how long before their stocks recover from a bear market, I’d guess the average answer would be 1-3 years. This can be supported in graphics like this from Visual Capitalist. See the “Average time to recovery” for 100% stocks (click to see full image at source).

This is the difference between average (3 years to recovery) and historical worst-case scenario (10+ years), not to mention the future could be even worse. It’s tough to design a portfolio around both these parameters. Do you have enough faith in your investing plan to withstand a 10+ year period of just S&P 500 dividends and no capital appreciation?

My Money Blog has partnered with CardRatings and may receive a commission from card issuers. Some or all of the card offers that appear on this site are from advertisers and may impact how and where card products appear on the site. MyMoneyBlog.com does not include all card companies or all available card offers. All opinions expressed are the author’s alone, and has not been provided nor approved by any of the companies mentioned.

MyMoneyBlog.com is also a member of the Amazon Associate Program, and if you click through to Amazon and make a purchase, I may earn a small commission. Thank you for your support.


Reader Question: Buying Individual Corporate Bonds on Secondary Market At 6% APY?

My Money Blog has partnered with CardRatings and may receive a commission from card issuers. Some or all of the card offers that appear on this site are from advertisers and may impact how and where card products appear on the site. MyMoneyBlog.com does not include all card companies or all available card offers. All opinions expressed are the author’s alone.

Here’s a good question from reader Elizabeth in response to yesterday’s post about buying Treasury bonds on the open secondary market:

One thing I’m interested in is on that same table you shared – Corporate bonds rated BBB are around 6% for 5 years. Can you write about this? What are the pros and cons?

Here’s my thought process. Yes, us “retail” investors can also buy individual corporate bonds via major brokers with a fixed income desk like Fidelity. (Bond trading is rare on newer trading apps like Robinhood.) The bonds are judged by various rating agencies and usually separated by their grading. Right now, I see a Moody’s BAA3-rated corporate bond with 5 years left until maturity paying 6.78% interest (click to enlarge):

However, corporate bonds are not within my circle of knowledge. The special thing about every single US Treasury bond is that they are all fully-backed by the US government. Same with an FDIC-insured bank CD or NCUA-insured credit union certificate. It’s like comparing all 16 oz. jars of JIF brand peanut butter; I know all of them are the same, so I can just buy on price.

Once you venture into the world of corporate bonds, things get a lot more complicated. There is wide range of potential credit risk from the issuing company. If the company fails, you may not receive your initial principal back. There is call risk from callable bonds where the issuer can redeem your bond early (to their benefit), not to mention several other early redemption wrinkles like “make whole call”, “sinking fund protection”, and “special optional redemptions”.

Baa3 and BBB- rated bonds are still technically “investment-grade”, but they are just one notch above “below investment-grade”, aka “junk”, aka “high-yield” bonds. Here is a quick table of bond ratings from Investopedia:

If take a closer look at the available bonds above, you’ll see that only one bond is paying over 6.7% and it doesn’t even have an S&P rating, which means there might be something funny going on. The rates quickly go back down to the 5.XX% range.

Do I know why one bond has to pay 6.7% interest rate to entice a buyer, while another one only has to offer 4.8%? I must admit that I really have no idea.

Bonds are for safety. In addition, I should remember my reason for holding bonds. They are my safety blanket. They are my next 10 years of expenses that are guaranteed to be there even if bad things happens. What if Russia bombed a NATO country tomorrow? The US would be obligated to go to war. China might then feel that it has to back Russia. Who knows. Hope for the best. Prepare for the worst.

My goal with bonds is to maximize yield without sacrificing safety.

Stocks are for growth and upside potential. Let’s take the bottom bond highlighted – an Ally Financial corporate bond paying 5.6% yield for the next 5 years. Ally Bank is familiar to me, and I am a longtime customer. Why not buy that bond? Well, if I bought that bond, the most that it will ever pay me back is the bond face value and interest. Worst case is still that Ally goes bankrupt and I lose all or most of my entire investment and end up with zero. This has happened, and to much larger companies than Ally.

Up to 6 days before their eventual collapse, Lehman Brothers had an A investment grade rating. The eventual recovery on their bonds was 21 cents on the dollar.

However, I could also buy Ally Financial stock (ticker ALLY). Right now, it is trading at only a 4.72 P/E ratio and is even paying a dividend yield of 3.54%. Five years from now, I could be sitting on a +50% or +100% or +200% total return. In other words, if you want to take on risk for a higher return, you are competing with stocks. There is ongoing debate about the inclusion of high-yield bonds in a portfolio, but I prefer to take risks with stocks and keep my bonds as safe as possible.

Consider a low-cost, diversified mutual fund or ETF. The benefit of holding riskier corporate bonds inside a mutual fund/ETF is that any one corporate bankruptcy won’t wipe you out. You can be diversified across hundreds of companies. Now, you can’t control the maturity as tightly, you’ll still lose some yield to management costs, and you’re still subject to interest rate risk. If you own the Vanguard Total Bond Market ETF (BND) or any Vanguard Target Retirement Fund, you already own corporate bonds inside a fund.

If I had to buy corporate bonds and wanted a stream of higher income without a reckless amount of credit risk, I would consider the Vanguard High-Yield Corporate Fund Investor Shares (VWEHX, $3k min) or Vanguard High-Yield Corporate Fund Admiral Shares (VWEAX, $50k min). VWEHX has a 0.23% expense ratio and a 30-day SEC yield of 6.71% as of 07/18/2022. VWEAX has a 0.13% expense ratio and a 30-day SEC yield of 6.81% as of 07/18/2022.

You are buying a basket of nearly 700 bonds that straddle the line between investment-grade and below investment-grade. This is a bond fund that I would own for the income stream, not if I needed the entire amount in cash soon as it can drop quite a lot during times of market stress. The expense ratio on this Vanguard fund is much lower than the industry average. Just a suggestion for further research. I don’t own this fund. In fact, I don’t own any corporate bonds at all.

Hope that helps!

My Money Blog has partnered with CardRatings and may receive a commission from card issuers. Some or all of the card offers that appear on this site are from advertisers and may impact how and where card products appear on the site. MyMoneyBlog.com does not include all card companies or all available card offers. All opinions expressed are the author’s alone, and has not been provided nor approved by any of the companies mentioned.

MyMoneyBlog.com is also a member of the Amazon Associate Program, and if you click through to Amazon and make a purchase, I may earn a small commission. Thank you for your support.


[Step-by-Step Guide] How To Buy Treasury Bonds on Secondary Market From Fidelity Brokerage

My Money Blog has partnered with CardRatings and may receive a commission from card issuers. Some or all of the card offers that appear on this site are from advertisers and may impact how and where card products appear on the site. MyMoneyBlog.com does not include all card companies or all available card offers. All opinions expressed are the author’s alone.

Fidelity fixed income page screenshot

Here is quick walkthrough from buying a (roughly) 1-year Treasury bond on the secondary market via my Fidelity brokerage account. Please note that I am not a professional bond trader nor a tax professional, and I won’t be able to cover every detail. I maintain part of my portfolio bond allocation in roughly a 5-year bond/CD ladder, comparing and buying the top rate amongst US Treasuries, bank CDs, and credit union certificates across the country as they are all fully-backed by the US government. This guarantees that every year, at least 20% of it is liquid and available in adverse conditions like job loss.

Treasury bonds vs. certificates of deposit. First, you’ll want to compare your Treasury bond effective yield against bank CD rates. At the time of this writing, 1-year Treasury was at ~3.10% while the top brokered 1-year CD was at 3% APY. Due to my local/state tax situation, the after-tax Treasury bond rate was comparable to a 1-year bank CD paying ~3.50%. Right now, the Treasury bond safely wins if held inside a taxable account.

New issue available? For example, if today was 7/15/2022 and I wanted to buy a new 52-week T-Bill from TreasuryDirect or Fidelity, I would look at the official auction schedule see that the next available date for a 52-week T-Bill is on Thursday 8/4/2022 to place an order, 8/9/2022 auction date, and 8/11/2022 settlement date. I have no idea what interest rates will be like then, and for my purposes I wanted to lock in now.

Buying secondary Treasuries on Fidelity. To buy bonds on Fidelity, you must log into your brokerage account and navigate to the “Fixed Income” section, where they will show a quick overview of current rates across roughly 75,000 fixed income investments from brokered CDs to high-yield corporate bonds. (See image at top of post. Click to enlarge.)

Next, click on the “Bonds” tab > US Treasury bonds > Secondary market. This narrows it down to about 578 bond CUSIPs. This search and trade was completed 7/15/2022.

Since I want a Treasury bond with only one year left until maturity, I set the filter for a maturity date between July 2023 and July 2023. That should narrow it down to only 5 bond CUSIPS. Let’s take a look at them (click to enlarge):

These are all “used” bonds that have already been issued and been paying someone else interest at their own rate. The market will adjust the price of these secondary bonds so that everything with a similar maturity ends up paying relatively close to a current “market” rate. Most of these started out paying really low interest rates, so right now you’ll often be buying them at a discount to their face value. (When interest rates go up, prices for existing bond go down since their interest payouts are lower.)

If you hold two bonds with the same “yield to maturity” all the way until it matures and pays you back the principal, you should end up with the same amount of gain at the end even if it is split differently between interest income and capital gain. (If you buy at a discount and have years left until maturity, a pro-rated portion of the discount is reported as income every year until maturity.)

Note that these price quotes are separated into “bid” and “ask”. Bid is what folks are offering to pay, and ask is the price at which folks are offering to sell. There is a spread between them because if there wasn’t, they would have matched up and sold. For example, someone might offer to sell at an effective 3.09% yield, with another offering to buy at 3.14% effective yield.

I’m a small fry, so I just pay attention to the “Ask” and the minimum quantity. Sometimes the offered price looks good but requires you to buy $500,000 of it! (1 bond = $1,000 face value.) Also, the prices are like stocks and fluctuate constantly, so don’t anchor yourself to any specific number. I might wish I could get that 3.20% I saw the day before, but that rate may or may not come back during my buying window.

When you’re ready, you can place a limit order. This lets you set a maximum price you’ll be willing to pay (and thus minimum yield). For example, I chose this Treasury bond that began life as a 5-year bond on 7/31/2018 and matures on 7/31/2023 with an annual coupon of 2.75%. I offered a price of 99.652 each, which guarantees me a minimum effective yield of 3.09% (exempt from state and local taxes). I recommend always using a limit order, just in case.

A note on commissions. Fidelity does not charge a commission (or mark-up) on secondary US Treasury bond purchases if performed online. There is still the indirect cost of the bid/ask spread, but that is more of a concern if I was to sell. I believe that Fidelity has close enough to the best order fill available to an individual investor. I haven’t compared them in detail, but be aware that others may charge a mark-up.

My order was successfully filled at $99.652, which means for 10 bonds with $10,000 face value, I paid $9,965.20 for the bonds plus a little more for any accrued interest. US Treasury bonds are not callable and the interest is paid semi-annually. My next interest payments (at the old bond’s lower 2.75% rate) will be on 7/31/2022, 1/31/2023 and 7/31/2023 with the full return of $10,000 face value at maturity. Again, based on my local/state tax situation, my after-tax interest will be comparable to a 1-year bank CD paying 3.50% APY. This compares well to the best available rates on cash right now.

My Money Blog has partnered with CardRatings and may receive a commission from card issuers. Some or all of the card offers that appear on this site are from advertisers and may impact how and where card products appear on the site. MyMoneyBlog.com does not include all card companies or all available card offers. All opinions expressed are the author’s alone, and has not been provided nor approved by any of the companies mentioned.

MyMoneyBlog.com is also a member of the Amazon Associate Program, and if you click through to Amazon and make a purchase, I may earn a small commission. Thank you for your support.


Fidelity Youth Brokerage Account: Free $50 for Teens (13-17yo, No Deposit Required)

My Money Blog has partnered with CardRatings and may receive a commission from card issuers. Some or all of the card offers that appear on this site are from advertisers and may impact how and where card products appear on the site. MyMoneyBlog.com does not include all card companies or all available card offers. All opinions expressed are the author’s alone.

Fidelity Investments has a new $50 promotion for their Youth account for teens (aged 13-17). Parents must have their own open Fidelity account before opening a Youth account. After you open a new Youth Account and your teen downloads the Fidelity Mobile® App and activates the new account, your teen will receive a $50 deposit as a reward. No deposit required, no monthly fees, no minimum balance required.

Details from their FAQ:

We are hoping to help your teen jumpstart their financial journey by helping them learn about money. Using our mobile app, they can access the Youth Learning Center, which is a resource created specifically to help teens learn the basics about saving, spending, and investing.

Parent/guardian must have their own Fidelity brokerage account to open an account for their teen.
Parent/guardian must initiate the application process and once completed, the teen will receive instructions on how to download the Fidelity Mobile® App and activate their account.
There are no funding requirements to receive this reward.
No further investment or trading is required to qualify for the offer.

The reward will be deposited directly to the eligible account within 10 calendar days after the teen has downloaded the Fidelity Mobile® App and activated their account (which entails creating a username/password, and logging into the mobile app and accepting account agreements). Amounts deposited by Fidelity in the form of the reward will be initially held in the Fidelity Government Money Market Fund,* the eligible account’s core position.

To open a Youth Account you will need 2 forms of documentation to verify your teen’s identity. Acceptable forms of documentation include:

– Your teen’s Social Security card OR a copy of the first page of your latest filed 1040 tax return. This document should have your teen’s name and Social Security number (SSN) clearly visible.
– An unexpired document with your teen’s name (state-issued driver’s license, passport, birth certificate, or student ID card).

My Money Blog has partnered with CardRatings and may receive a commission from card issuers. Some or all of the card offers that appear on this site are from advertisers and may impact how and where card products appear on the site. MyMoneyBlog.com does not include all card companies or all available card offers. All opinions expressed are the author’s alone, and has not been provided nor approved by any of the companies mentioned.

MyMoneyBlog.com is also a member of the Amazon Associate Program, and if you click through to Amazon and make a purchase, I may earn a small commission. Thank you for your support.


Treasury Bond vs. Bank CD Rates: Adjusting For State and Local Income Taxes

My Money Blog has partnered with CardRatings and may receive a commission from card issuers. Some or all of the card offers that appear on this site are from advertisers and may impact how and where card products appear on the site. MyMoneyBlog.com does not include all card companies or all available card offers. All opinions expressed are the author’s alone.

If you are an individual investor that usually buys bank certificates of deposit, right now you may want to compare against a US Treasury bond of similar maturity. Treasury bond rates are traded constantly, but this Vanguard brokered CD page can provide a rough idea if they are worth a closer look (even though their brokered CD may or may not be the best CD rate available). Again, this screenshot is already out of date:

Right now, they are pretty close for many maturity lengths. For example, let’s take a 1-year CD paying 3% APY and a 1-year Treasury bond paying 3%.

(Note: This may not be true by the time you read this. Here are the current Treasury bond rates. In the last two weeks alone, the 1-year Treasury has ranged from 2.79 to 3.21%. In 2022 alone, the low was 0.38%.)

An important consideration is that Treasury bonds are exempt from state and local taxes. This can make the Treasury bond significantly more attractive to some folks, even if the initial rate is the same. This assumes you are investing in a taxable account (not tax-sheltered). US Savings bonds are also exempt from state and local taxes.

For example, let’s say you are a single resident of California with a taxable income of $80,000 annually. Any easy way to compare the rates is by using a calculator like this Fidelity tax-equivalent yield calculator. Using the example income, it will find that your marginal tax rates are 22% Federal and 9.30% State (CA). I am assuming no local tax rates from your city or county.

What matters in the end is what you are left with after taxes. As such, the calculator supplies the following chart:

For this example person, a Treasury bond earning 3% will pay the same after-tax interest as a bank certificate of deposit paying 3.44%.

Here is a rough check on my part:

$10,000 * 3.44% * (1 – 0.22 – 0.093) = $236 in annual interest, after taxes

$10,000 * 3.00% * (1 – 0.22) = $234 in annual interest, after taxes

I suspect the minor difference has to do with the way that bond yields are quoted for Treasury bonds. This is also why the corporate bond yields are different from the CD yields even though they are subject to the same taxes.

Bond yields, except CDs, are assumed to be twice the semi-annual yield, as is the normal convention for quoting bond yields. CD yield is calculated as ((( corporate bond yield / 2) +1)² ) – 1

From the calculator fine print:

The calculator does not take into account:

– Reductions and limits on federal itemized deductions
– State and local taxes are not deducted from your federal tax rate. Depending on your personal situation, this may cause the resulting yield to be overstated.
– Federal alternative minimum tax (AMT)
– State alternative minimum tax
– Intangibles taxes levied by individual states
– Net Investment Income Tax
– Additional Medicare Tax

For practical purposes, I don’t sweat the minor differences. In order to actually buy many of these Treasury bonds at the time that you want and for the remaining maturity length that you want, you’ll have to buy them on the open secondary market. The available rates will change by the minute. Or, if you buy them as a new issue, you won’t know the rate at all as it is determined at auction. I mostly just want to know that the Treasury bond is preferable to a bank CD by an adequate margin. In this example, I would say that 0.44% higher annually is enough of a margin.

There are other wrinkles… if you don’t hold to maturity, Treasury bonds don’t offer the ability to withdraw early and only pay a preset interest penalty like a bank CD. You’d have to sell again on the open market, where you may lose (or gain) principal.

Armed with this information, you might create your own bond ladder using US Treasuries instead of a CD ladder. This is easy for an individual investor because you don’t need any skill to determine creditworthiness. Both US Treasury bonds and FDIC/NCUA-insured certificates of deposit are backed by the full faith and credit of the US government. (Municipal bonds don’t come with such a guarantee. Some municipalities are in better financial shape than others. I don’t buy individual municipal bonds for this reason.)

My Money Blog has partnered with CardRatings and may receive a commission from card issuers. Some or all of the card offers that appear on this site are from advertisers and may impact how and where card products appear on the site. MyMoneyBlog.com does not include all card companies or all available card offers. All opinions expressed are the author’s alone, and has not been provided nor approved by any of the companies mentioned.

MyMoneyBlog.com is also a member of the Amazon Associate Program, and if you click through to Amazon and make a purchase, I may earn a small commission. Thank you for your support.


MMB Portfolio 2022 2nd Quarter Update: Dividend & Interest Income

My Money Blog has partnered with CardRatings and may receive a commission from card issuers. Some or all of the card offers that appear on this site are from advertisers and may impact how and where card products appear on the site. MyMoneyBlog.com does not include all card companies or all available card offers. All opinions expressed are the author’s alone.

via GIPHY

Here’s my quarterly update on the income produced by my Humble Portfolio (2022 Q2). I track the income produced as an alternative metric for performance. The total income goes up much more gradually and consistently than the number shown on brokerage statements (price), which helps encourage consistent investing. I imagine them as building up a factory that churns out dollar bills. You can still track your dividend and interest income with a total return portfolio. You don’t need a bunch of high-yield stocks, MLPs, leveraged REITs, or covered call ETFs.

Background: Overall stock market dividend growth. Stock dividends are a portion of net profits that businesses have decided to distribute directly to shareholders, as opposed to reinvesting into their business, paying back debt, or buying back shares directly. The dividends may suffer some short-term drops, but over the long run they have grown faster than inflation.

In the US, the dividend culture is somewhat conservative in that shareholders expect dividends to be stable and only go up. Dividend cuts tend to be avoided. Thus the starting yield is lower, but it can grow faster. Here is the historical growth of the trailing 12-month (ttm) dividend paid by the Vanguard Total US Stock ETF (VTI), courtesy of StockAnalysis.com. Currently, 31% of VTI’s net earnings are sent to you as a dividend. Notice how it grows gradually, with the current annual dividend 76% higher than in September 2013:

European corporate culture tends to encourage paying out a higher (sometimes fixed) percentage of earnings as dividends, but that means the dividends move up and down with earnings. Thus the starting yield is higher but may not grow as fast. Here is the historical growth of the trailing 12-month (ttm) dividend paid by the Vanguard Total International Stock ETF (VXUS). Currently, 47% of VXUS’s net earnings are sent to you as a dividend. Notice how it stays more stable (but also dropped during 2020 due to COVID), with the current annual dividend only 25% higher than in September 2013:

The dividend yield (dividends divided by price) also serve as a rough valuation metric. When stock prices drop, this percentage metric usually goes up – which makes me feel better in a bear market. When stock prices go up, this percentage metric usually goes down, which keeps me from getting too euphoric during a bull market. Here’s a related quote from Jack Bogle (source):

The true investor will do better if he forgets about the stock market and pays attention to his dividend returns and to the operating results of his companies.

My personal portfolio income history. I started tracking the income from my portfolio in 2014. Here’s what the annual distributions from my portfolio look like over time:

  • $1,000,000 invested in my portfolio as of January 2014 would have generated about $24,000 in annual income over the previous 12 months. (2.4% starting yield)
  • If I reinvested the income but added no other contributions, today in 2022 it would have generated ~$48,000 in annual income over the previous 12 months.

This chart shows how the annual income generated by my portfolio has changed.

TTM income yield. To estimate the income from my portfolio, I use the weighted “TTM” or “12-Month Yield” from Morningstar, which is the sum of the trailing 12 months of interest and dividend payments divided by the last month’s ending share price (NAV) plus any capital gains distributed (usually zero for index funds) over the same period. The trailing income yield for this quarter was 2.99%, as calculated below. Then I multiply by the current balance from my brokerage statements to get the total income.

Asset Class / Fund % of Portfolio Trailing 12-Month Yield Yield Contribution
US Total Stock (VTI) 25% 1.61% 0.40%
US Small Value (VBR) 5% 2.12% 0.11%
Int’l Total Stock (VXUS) 25% 3.87% 0.97%
Emerging Markets (VWO) 5% 3.35% 0.17%
US Real Estate (VNQ) 6% 3.14% 0.19%
Inter-Term US Treasury Bonds (VGIT) 17% 1.25% 0.21%
Inflation-Linked Treasury Bonds (VTIP) 17% 5.59% 0.95%
Totals 100% 2.99%


Commentary. My ttm yield is now ~3%. Both US and international stock prices have gone down, and my ttm dividend yield has gone up. The price of my Treasury bonds have also gone down as nominal rates have gone up, but the yield will eventually go up as the money is reinvested into new bonds at higher rates. My TIPS yield has gone up significantly as CPI inflation has spiked. Of course, the NAV on my TIPS has also gone down, as real yields have gone up (again will be better as money is reinvested). TIPS are a bit complicated like that.

Use as a retirement planning metric. As a very rough goal, I support the simple 4% or 3% rule of thumb, which equates to a target of accumulating roughly 25 to 33 times your annual expenses. I would lean towards a 3% withdrawal rate if you want to retire young (before age 50) and a 4% withdrawal rate if retiring at a more traditional age (closer to 65). It’s just a target, not a number sent down from a higher being. During the accumulation stage, your time is better spent focusing on earning potential via better career moves, improving in your skillset, and/or looking for entrepreneurial opportunities where you can have an ownership interest.

Even if do you reach that 25X or 30X goal, it’s just a moment in time. The market can shift, your expenses can shift, and so I find that tracking income makes more tangible sense in my mind and is more useful for those who aren’t looking for a traditional retirement. Our dividends and interest income are not automatically reinvested. They are another “paycheck”. Then, as with a traditional paycheck, we can choose to either spend it or invest it again to compound things more quickly. Even if we spend the dividends, this portfolio paycheck will still grow over time. You could use this money to cut back working hours, pursue a different career path, start a new business, take a sabbatical, perform charity or volunteer work, and so on. This is your one life and it only lasts about 4,000 weeks.

My Money Blog has partnered with CardRatings and may receive a commission from card issuers. Some or all of the card offers that appear on this site are from advertisers and may impact how and where card products appear on the site. MyMoneyBlog.com does not include all card companies or all available card offers. All opinions expressed are the author’s alone, and has not been provided nor approved by any of the companies mentioned.

MyMoneyBlog.com is also a member of the Amazon Associate Program, and if you click through to Amazon and make a purchase, I may earn a small commission. Thank you for your support.


MMB Humble Portfolio 2022 2nd Quarter Update: Asset Allocation & Performance

My Money Blog has partnered with CardRatings and may receive a commission from card issuers. Some or all of the card offers that appear on this site are from advertisers and may impact how and where card products appear on the site. MyMoneyBlog.com does not include all card companies or all available card offers. All opinions expressed are the author’s alone.

portpie_blank200Here’s my quarterly update on my current investment holdings as of 7/8/22, including our 401k/403b/IRAs and taxable brokerage accounts but excluding real estate and side portfolio of self-directed investments. Following the concept of
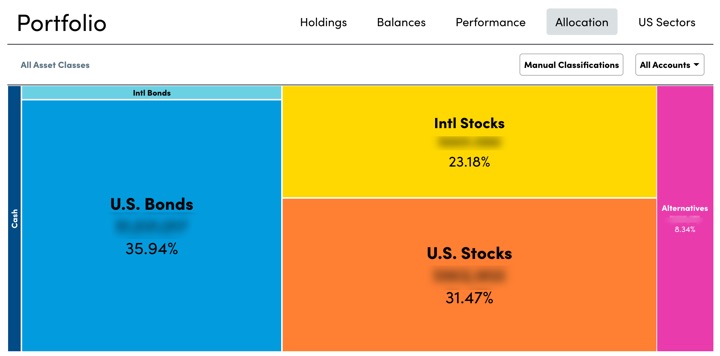
 skin in the game, the following is not a recommendation, but just to share an real, imperfect, low-cost, diversified DIY portfolio. The goal of this “Humble Portfolio” is to create sustainable income that keeps up with inflation to cover our household expenses.

“Never ask anyone for their opinion, forecast, or recommendation. Just ask them what they have in their portfolio.” – Nassim Taleb

TL;DR changes: Went from 67/33 stocks/bonds ratio to 64/36, so buying more US and International Stocks with available cashflow.

How I Track My Portfolio
I’m often asked how I track my portfolio across multiple brokers and account types. (Morningstar also recently discontinued free access to their portfolio tracker.) I use both Personal Capital and a custom Google Spreadsheet to track my investment holdings:

  • The Personal Capital financial tracking app (free, my review) automatically logs into my different accounts, adds up my various balances, tracks my performance, and calculates my overall asset allocation daily.
  • Once a quarter, I also update my manual Google Spreadsheet (free, instructions) because it helps me calculate how much I need in each asset class to rebalance back towards my target asset allocation. I also create a new tab each quarter, so I have snapshot of my holdings dating back many years.

July 2022 Asset Allocation and YTD Performance
Here are updated performance and asset allocation charts, per the “Allocation” and “Holdings” tabs of my Personal Capital account.

Target Asset Allocation. I call this my “Humble Portfolio” because it accepts the repeated findings that individuals cannot reliably time the market, and that persistence in above-average stock-picking and/or sector-picking is exceedingly rare. Costs matter and nearly everyone who sells outperformance, for some reason keeps charging even if they provide zero outperformance! By paying minimal costs including management fees and tax drag, you can actually guarantee yourself above-average net performance over time.

I own broad, low-cost exposure to productive assets that will provide long-term returns above inflation, distribute income via dividends and interest, and finally offer some historical tendencies to balance each other out. I have faith in the long-term benefit of owning publicly-traded US and international shares of businesses, as well as the stability of high-quality US Treasury and municipal debt. My stock holdings roughly follow the total world market cap breakdown at roughly 60% US and 40% ex-US. I add some “spice” to the vanilla funds with the inclusion of “small value” ETFs for US, Developed International, and Emerging Markets stocks as well as additional real estate exposure through US REITs.

I strongly believe in the importance of knowing WHY you own something. Every asset class will eventually have a low period, and you must have strong faith during these periods to truly make your money. You have to keep owning and buying more stocks through the stock market crashes. You have to maintain and even buy more rental properties during a housing crunch, etc. A good sign is that if prices drop, you’ll want to buy more of that asset instead of less. I don’t have strong faith in the long-term results of commodities, gold, or bitcoin – so I don’t own them.

I do not spend a lot of time backtesting various model portfolios, as I don’t think picking through the details of the recent past will necessarily create superior future returns. Usually, whatever model portfolio is popular in the moment just happens to hold the asset class that has been the hottest recently as well.

Find productive assets that you believe in and understand, and just keep buying them through the ups and downs. Mine may be different than yours.

I have settled into a long-term target ratio of roughly 70% stocks and 30% bonds (or 2:1 ratio) within our investment strategy of buy, hold, and occasionally rebalance. This is more conservative than most people my age, but I am settling into a more “perpetual income portfolio” as opposed to the more common “build up a big stash and hope it lasts until I die” portfolio. My target withdrawal rate is 3% or less. Here is a round-number breakdown of my target portfolio.

  • 30% US Total Market
  • 5% US Small-Cap Value
  • 20% International Total Market
  • 5% International Small-Cap Value
  • 10% US Real Estate (REIT)
  • 20% High-Quality bonds, Municipal, US Treasury or FDIC-insured deposits
  • 10% US Treasury Inflation-Protected Bonds (or I Savings Bonds)

Commentary. According to Personal Capital, my portfolio down about 16% for 2022 YTD. My US and International stocks have dropped enough that all new cashflow is being placed into buying more of those asset classes. Simple as that. Keep on truckin’.

Since that was so short and boring, here a quick fact that I keep in my head. Using the “Rule of 72”, we know that if your portfolio returns 7% a year, it will double roughly every 10 years. $10,000 invested for 10 years will double to $20,000. However, $10,000 invested for 20 years will quadruple into $40,000. $10,000 invested for 30 years will octuple into $80,000. That provides a sense of the power of compounding and how it starts slow but kicks into turbo mode later on. I’ve been investing for about 20 years, so I’m getting to the good part! 😉

I’ll share about more about the income aspect in a separate post.

My Money Blog has partnered with CardRatings and may receive a commission from card issuers. Some or all of the card offers that appear on this site are from advertisers and may impact how and where card products appear on the site. MyMoneyBlog.com does not include all card companies or all available card offers. All opinions expressed are the author’s alone, and has not been provided nor approved by any of the companies mentioned.

MyMoneyBlog.com is also a member of the Amazon Associate Program, and if you click through to Amazon and make a purchase, I may earn a small commission. Thank you for your support.