M1 Finance Backdoor Roth IRA Instructions, How To w/ Screenshots

My Money Blog has partnered with CardRatings and may receive a commission from card issuers. Some or all of the card offers that appear on this site are from advertisers and may impact how and where card products appear on the site. MyMoneyBlog.com does not include all card companies or all available card offers. All opinions expressed are the author’s alone.

I recently completed a Backdoor Roth IRA contribution at M1 Finance (my review), so here is a detailed step-by-step walkthrough of the process along with screenshots based on my actual experience. M1 Finance currently has a new customer bonus offer up to $150 for new accounts, based on initial deposit amount. You can also add on the up to $2,500 transfer bonus for moving assets over from another brokerage firm. (Disclosure: I am now an affiliate of M1 Finance, and may be compensated if you click through my link and open a new account.)

Quick background. The Backdoor Roth IRA is a way for individuals to fund a Roth IRA even though their income (modified AGI) exceeds the phaseout limits set for a direct Roth IRA contribution. ($140,000 MAGI for individuals, $208,000 MAGI for married filing joint in 2021.) I won’t go deep into the details, but the general idea is:

  • An individual can contribute to a Traditional IRA without any income limits. However, the contribution is not tax-deductible if you exceed the income limits.
  • An individual can also convert a Traditional IRA to a Roth IRA, also without any income limits. You won’t owe any taxes on those non-deductible IRA contributions, because they are already after-tax.
  • Perform these two steps right after each other, and you have a “Backdoor” Roth IRA.

There are other considerations and details involved, so please do your own research before taking action. Roth conversions cannot be undone. This option may go away in 2022, so if you have any Traditional IRA balances that you have been considering to convert to a Roth IRA, you may want to make your decision before the end of 2021.

M1 Finance Backdoor Roth IRA walkthrough.

Open a new Traditional IRA account and fund it. If you already have an M1 account, click on the name of your portfolio in the top right area, and then click on “Add account”.

Choose “Retirement”, then “Traditional IRA”, then read and accept the terms. Next, you will have the option to select an investment “pie”, but since you are going to convert this quickly to a Roth IRA, it’s fine to just choose something close to cash. One option is the PIMCO Enhanced Short Maturity Active ETF (search for ticker MINT), add it your pie basket, and make it 100%. Finally, you must fund it, probably using your bank account numbers unless you have an existing M1 Finance account or other ideas.

Open a separate Roth IRA account, but do NOT fund it. M1 wants you to have the Roth IRA set up before any conversion request can be made. So start like above and open a new Retirement account, but this time pick Roth IRA. You can now pick your “real” investment portfolio pie, but again don’t fund it! Just think of it as an empty container for now.

Wait for a bit. It may take a few days for your Traditional IRA to get set up, funded, and invested into something. This step is still important. Some people even wait for the Traditional IRA to generate a full monthly account statement so they have paper documentation that they completed this step. Others just wait a day and then move on.

Find both your Traditional and Roth IRA account numbers. It’s conversion time. To find your account numbers, find your name in the top right corner. Click on that, and then click on “View Account Settings”. Then click on the subheading “Accounts”. You should end up with a list of your account nicknames, account numbers, and account types.

Request the conversion, sign and return documents. You can request the conversion via their automated chat bot, secure message, or phone number during business hours. I was able to complete the entire process via chat bot and email without having to use the phone. Here’s my chat transcript with personal details removed:

USER: roth conversion

BOT: M1 Invest can perform IRA conversions. Please keep in mind that due to high volumes, transfers can take 5-7 business days to complete. To get started with this process, please reply with the following information:

BOT: What is the M1 Invest account number of the traditional IRA you would like to convert out of?

USER: XXXXXXXX

BOT: What is the M1 Invest account number of the Roth IRA you would like to convert into?

USER: XXXXXXXX

BOT: What is the amount you would like to convert (if full account conversion, please simply confirm ‘full account’)?

USER: full account

BOT: What is the email address you use to login to M1?

USER: xx@xx.com

Within an hour, they emailed me a PDF form that I had to complete and sign. I uploaded the signed PDF into their secure drop box, and had confirmation that they had sent the request over to their clearing firm within another hour or so.

Jonathan,

We have submitted this conversion to our clearing firm. Both accounts will be paused for the duration of the transfer. We will notify you once the transfer is complete and you will see the funds placed in the correct account.

If you are transferring securities, please make sure the securities you are transferring are located in your Roth IRA portfolio.

This process can take 1-3 business days to complete.

Best,
Brokerage Operations
M1 Team

Once it shows in my M1 Invest dashboard that the funds have been moved into my Roth IRA account, then I’ll be done. I should be sent a form at tax time regarding the amount converted. If I contributed $6,000 to the non-deductible Traditional IRA and the value didn’t change at the time of conversion, then I won’t have any capital gains to pay taxes on. My $6,000 Backdoor Roth IRA contribution will be complete and now I can enjoy tax-free growth and tax-free withdrawals of all future gains. I hope you find this useful for informational purposes.

My Money Blog has partnered with CardRatings and may receive a commission from card issuers. Some or all of the card offers that appear on this site are from advertisers and may impact how and where card products appear on the site. MyMoneyBlog.com does not include all card companies or all available card offers. All opinions expressed are the author’s alone, and has not been provided nor approved by any of the companies mentioned.

MyMoneyBlog.com is also a member of the Amazon Associate Program, and if you click through to Amazon and make a purchase, I may earn a small commission. Thank you for your support.


Charlie Munger: A Double Layer of Risk Protection

My Money Blog has partnered with CardRatings and may receive a commission from card issuers. Some or all of the card offers that appear on this site are from advertisers and may impact how and where card products appear on the site. MyMoneyBlog.com does not include all card companies or all available card offers. All opinions expressed are the author’s alone.

My current commute/workout/kid taxi listening is old Berkshire Hathaway shareholder meetings after finding them in podcast format. (I know, out of all the choices available, somehow I find these the most stimulating?!) Here is a educational excerpt from the 2008 BRK meeting (transcript and video available at CNBC) where Charlie Munger is discussing how Berkshire works to avoid low-probability problems that could destroy the company now and in the future.

CHARLIE MUNGER: Yeah. You can see how risk averse Berkshire is. In the first place, we try and behave in a way so that no rational person is going to worry about our credit.

And after we’ve done that, and done it for many years, we also behave in a way that, if the world suddenly didn’t like our credit, we wouldn’t even notice it for months, because we have such liquidity and are so unlikely to be — unable to be — pressured by anybody.

That double layering of protection against risk is like breathing around Berkshire. It’s just part of the culture.

[…]

We do not want to be dependent on anybody or anything else. And yet we want to keep doing things.

So, we’ve found a way to do it — we think we found a way — to do that. It may give up some of the — well, obviously gives up earning higher returns 99 percent of the time, and maybe 99.9 percent of the time.

Obviously, we could have run Berkshire with more leverage over the years than we have. But we wouldn’t have slept as well, and we wouldn’t feel comfortable — we’d have a lot of people in this room that have almost all their net worth in Berkshire, including me — and we wouldn’t feel comfortable running a business that way.

Why do it? I mean, it doesn’t — it just doesn’t make any sense to us to be exposed to ruin and disgrace and embarrassment and — for something that’s not that meaningful.

If we can earn a decent return on capital, you know, what’s an extra percentage point? It just isn’t that important.

Takeaways. The parallels for personal finance seem pretty straightforward:

  • Maintain an excellent credit reputation (score). Having a good credit score will help you borrow for a house, buy a car, lower your insurance premiums in many cases, and finance larger projects and transactions. However, that credit line may still disappear quickly in a crisis.
  • Maintain adequate liquidity separate from any credit lines. Imagine that you lose your job and can’t find a new one for six months. Can your household survive without major disruption? What if at the same time, your stocks also got a 50% haircut and everyone else is suffering as well? Do you have cash or liquid assets to tide you over?
  • Accept that this level of safety means you won’t earn the highest returns. You’ll do fine, but you may not do as well as someone else who bet it all (or more than all using leverage) what happened to be the right thing during the good times. That’s okay, because you won’t be exposed to ruin.
My Money Blog has partnered with CardRatings and may receive a commission from card issuers. Some or all of the card offers that appear on this site are from advertisers and may impact how and where card products appear on the site. MyMoneyBlog.com does not include all card companies or all available card offers. All opinions expressed are the author’s alone, and has not been provided nor approved by any of the companies mentioned.

MyMoneyBlog.com is also a member of the Amazon Associate Program, and if you click through to Amazon and make a purchase, I may earn a small commission. Thank you for your support.


MMB Portfolio Update October 2021 (Q3): Dividend and Interest Income

My Money Blog has partnered with CardRatings and may receive a commission from card issuers. Some or all of the card offers that appear on this site are from advertisers and may impact how and where card products appear on the site. MyMoneyBlog.com does not include all card companies or all available card offers. All opinions expressed are the author’s alone.

dividendmono225While my 3rd Quarter 2021 portfolio asset allocation is designed for total return, I also track the income produced quarterly. Stock dividends are the portion of profits that businesses have decided they don’t need to reinvest into their business. The dividends may suffer some short-term drops, but over the long run they have grown faster than inflation.

I track the “TTM” or “12-Month Yield” from Morningstar, which is the sum of the trailing 12 months of interest and dividend payments divided by the last month’s ending share price (NAV) plus any capital gains distributed over the same period. (ETFs rarely have to distribute capital gains.) I prefer this measure because it is based on historical distributions and not a forecast. Below is a rough approximation of my portfolio (2/3rd stocks and 1/3rd bonds).

Asset Class / Fund % of Portfolio Trailing 12-Month Yield (Taken 10/17/21) Yield Contribution
US Total Stock
Vanguard Total Stock Market Fund (VTI, VTSAX)
25% 1.28% 0.32%
US Small Value
Vanguard Small-Cap Value ETF (VBR)
5% 1.67% 0.08%
International Total Stock
Vanguard Total International Stock Market Fund (VXUS, VTIAX)
25% 2.56% 0.64%
Emerging Markets
Vanguard Emerging Markets ETF (VWO)
5% 2.25% 0.11%
US Real Estate
Vanguard REIT Index Fund (VNQ, VGSLX)
6% 2.65% 0.16%
Intermediate-Term High Quality Bonds
Vanguard Intermediate-Term Treasury ETF (VGIT)
17% 1.18% 0.20%
Inflation-Linked Treasury Bonds
Vanguard Short-Term Inflation-Protected Securities ETF (VTIP)
17% 2.26% 0.38%
Totals 100% 1.89%


Trailing 12-month yield history. Here is a chart showing how this 12-month trailing income rate has varied since I started tracking it in 2014.

Maintaining perspective on portfolio value. One of the things I like about using this number is that when stock prices drop, this percentage metric usually goes up – which makes me feel better in a bear market. When stock prices go up, this percentage metric usually goes down, which keeps me from getting too euphoric during a bull market.

Here’s a related quote from Jack Bogle (source):

The true investor will do better if he forgets about the stock market and pays attention to his dividend returns and to the operating results of his companies.

Absolute dividend income. This quarter’s trailing income yield of 1.89% is still near the all-time lows since 2014. At the same time, both the portfolio value and the absolute income produced is higher than in 2014. If you retired back in 2014 and have been living off your stock/bond portfolio, you’ve been doing fine.

Here is the historical growth of the S&P 500 absolute dividend, updated as of Q3 2021 (source):

This means that if you owned enough of the S&P 500 to produce an annual dividend income of about $13,000 a year in 1999, then today those same shares would be worth a lot more AND your annual dividend income would have increased to over $50,000 a year, even if you had spent every penny of dividend income every year.

As a result, I prefer looking at absolute income produced rather than portfolio value or dividend yield percentages. Total income goes up much more gradually and consistently, encouraging me as I keep plowing more of my savings into more stock purchases. I imagine them as a factory that just churns out more dollar bills.

via GIPHY

Big picture and rules of thumb. If you are not close to retirement, there is not much use worrying about these decimal points. Your time is better spent focusing on earning potential via better career moves, improving in your skillset, and/or looking for entrepreneurial opportunities where you can have an ownership interest.

I support the common 4% or 3% rule of thumb, which equates to a target of accumulating roughly 25 to 30 times your annual expenses. I would lean towards a 3% withdrawal rate if you want to retire young (before age 50) and a 4% withdrawal rate if retiring at a more traditional age (closer to 65). Build in some spending flexibility to make your portfolio more resilient in the real world, and that’s perfectly good goal to put on your wall.

How we handle this income. Our dividends and interest income are not automatically reinvested. I treat this money as part of our “paycheck”. Then, as with a traditional paycheck, we can choose to either spend it or invest it again. Even if still working, you could use this money to cut back working hours, pursue new interests, start a new business, spend more time with your family and loved ones, travel, perform charity or volunteer work, and so on. This is your one life and it only lasts about 4,000 weeks.

My Money Blog has partnered with CardRatings and may receive a commission from card issuers. Some or all of the card offers that appear on this site are from advertisers and may impact how and where card products appear on the site. MyMoneyBlog.com does not include all card companies or all available card offers. All opinions expressed are the author’s alone, and has not been provided nor approved by any of the companies mentioned.

MyMoneyBlog.com is also a member of the Amazon Associate Program, and if you click through to Amazon and make a purchase, I may earn a small commission. Thank you for your support.


MMB Portfolio Update October 2021 (Q3): Asset Allocation & Performance

My Money Blog has partnered with CardRatings and may receive a commission from card issuers. Some or all of the card offers that appear on this site are from advertisers and may impact how and where card products appear on the site. MyMoneyBlog.com does not include all card companies or all available card offers. All opinions expressed are the author’s alone.

portpie_blank200
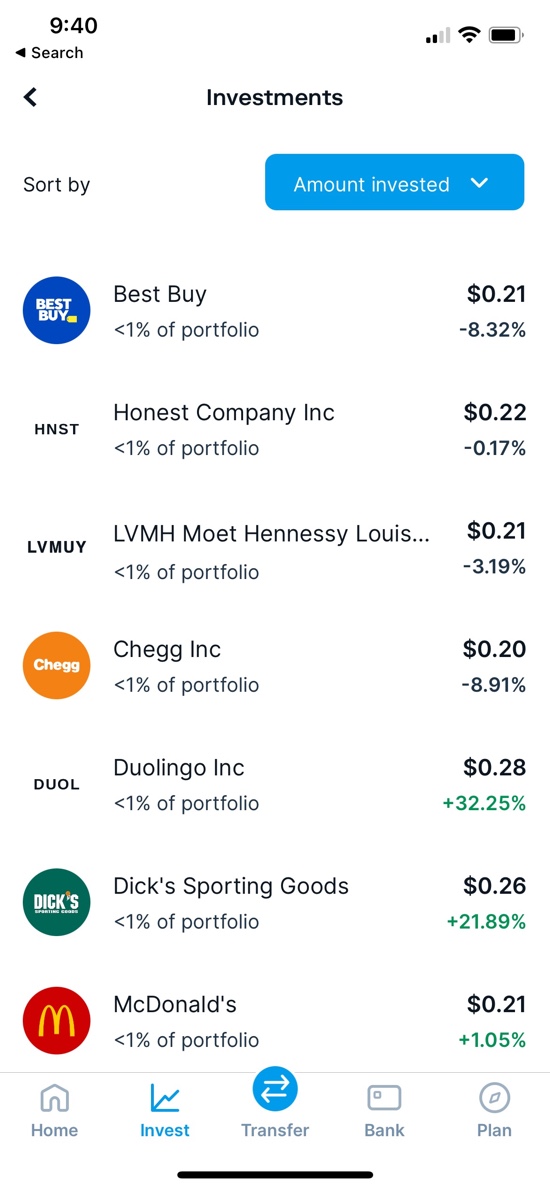
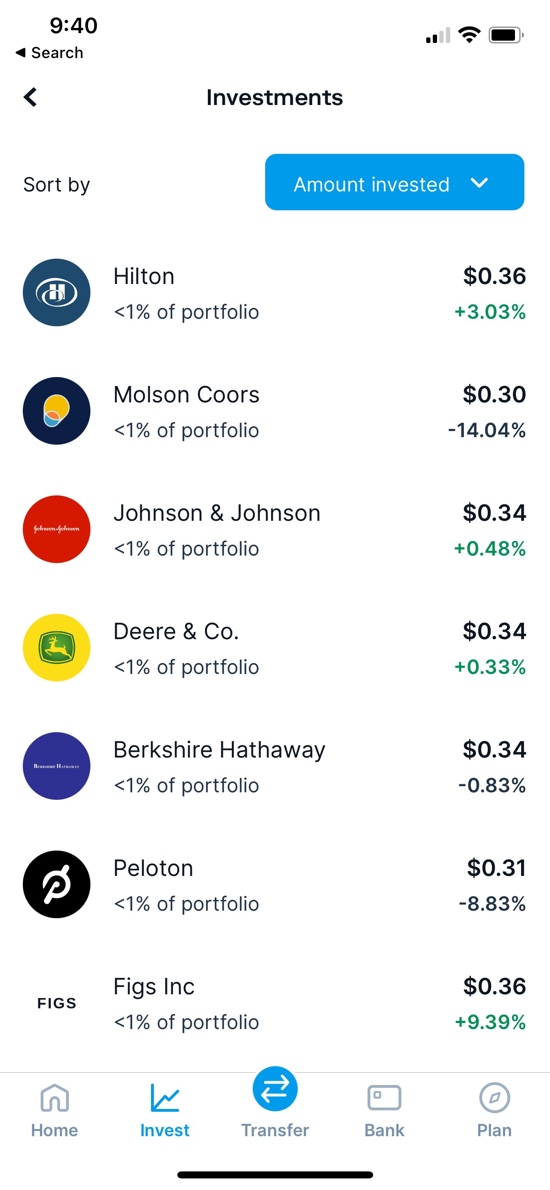
Here’s my quarterly update on my current investment holdings as of October 2021, including our 401k/403b/IRAs and taxable brokerage accounts but excluding our house, “emergency fund” cash reserves, and a side portfolio of self-directed investments. Following the concept of skin in the game, the following is not a recommendation, but just to share an actual, low-cost, diversified DIY portfolio complete with some real-world messiness. The goal of this portfolio is to create sustainable income that keeps up with inflation to cover our household expenses.

Actual Asset Allocation and Holdings
I use both Personal Capital and a custom Google Spreadsheet to track my investment holdings. The Personal Capital financial tracking app (free, my review) automatically logs into my different accounts, adds up my various balances, tracks my performance, and calculates my overall asset allocation. Once a quarter, I also update my manual Google Spreadsheet (free, instructions) because it helps me calculate how much I need in each asset class to rebalance back towards my target asset allocation.

Here are updated performance and asset allocation charts, per the “Allocation” and “Holdings” tabs of my Personal Capital account, respectively. (The blue line went flat for a while because the synchronization stopped and I don’t checked my performance constantly.)

Stock Holdings
Vanguard Total Stock Market (VTI, VTSAX)
Vanguard Total International Stock Market (VXUS, VTIAX)
Vanguard Small Value (VBR)
Vanguard Emerging Markets (VWO)
Avantis International Small Cap Value ETF (AVDV)
Cambria Emerging Shareholder Yield ETF (EYLD)
Vanguard REIT Index (VNQ, VGSLX)

Bond Holdings
Vanguard Limited-Term Tax-Exempt (VMLTX, VMLUX)
Vanguard Intermediate-Term Tax-Exempt (VWITX, VWIUX)
Vanguard Intermediate-Term Treasury (VFITX, VFIUX)
Vanguard Inflation-Protected Securities (VIPSX, VAIPX)
Fidelity Inflation-Protected Bond Index (FIPDX)
iShares Barclays TIPS Bond (TIP)
Individual TIPS bonds
U.S. Savings Bonds (Series I)

Target Asset Allocation. This “Humble Portfolio” does not rely on my ability to pick specific stocks, sectors, trends, or countries. I own broad, low-cost exposure to asset classes that will provide long-term returns above inflation, distribute income via dividends and interest, and finally offer some historical tendencies to balance each other out. I have faith in the long-term benefit of owning publicly-traded US and international shares of businesses, as well as high-quality US federal and municipal debt. My stock holdings roughly follow the total world market cap breakdown at roughly 60% US and 40% ex-US. I also own real estate through REITs.

I strongly believe in the importance of doing your own research. Every asset class will eventually have a low period, and you must have strong faith during these periods to truly make your money. You have to keep owning and buying more stocks through the stock market crashes. You have to maintain and even buy more rental properties during a housing crunch, etc. A good sign is that if prices drop, you’ll want to buy more of that asset instead of less.

I do not spend a lot of time backtesting various model portfolios, as I don’t think picking through the details of the recent past will necessarily create superior future returns. Usually, whatever model portfolio is popular in the moment just happens to hold the asset class that has been the hottest recently as well. I’ve also realized that I don’t have strong faith in the long-term results of commodities, gold, or bitcoin. I’ve tried many times to wrap my head around it, but have failed. I prefer things that send me checks while I sleep.

This is not the optimal, perfect, ideal anything. It’s just what I came up with, and it’s done the job. You may have different beliefs based on your own research and psychological leanings. Holding a good asset that you understand is better than owning and selling the highest-return asset when it is at its temporary low point.

Stocks Breakdown

  • 45% US Total Market
  • 7% US Small-Cap Value
  • 31% International Total Market
  • 7% International Small-Cap Value
  • 10% US Real Estate (REIT)

Bonds Breakdown

  • 66% High-Quality bonds, Municipal, US Treasury or FDIC-insured deposits
  • 33% US Treasury Inflation-Protected Bonds (or I Savings Bonds)

I have settled into a long-term target ratio of 67% stocks and 33% bonds (2:1 ratio) within our investment strategy of buy, hold, and occasionally rebalance. This is more conservative than most people my age, but I am settling into a more “perpetual portfolio” as opposed to the more common accumulate/decumulate portfolio. I use the dividends and interest to rebalance whenever possible in order to avoid taxable gains. I plan to only manually rebalance past that if the stock/bond ratio is still off by more than 5% (i.e. less than 62% stocks, greater than 72% stocks). With a self-managed, simple portfolio of low-cost funds, we can minimize management fees, commissions, and taxes.

Holdings commentary. The fact that I did research about Shiba Inu coins today is the latest evidence that there is too much money sloshing around chasing speculative investments. Somehow, I own 4,000,000 SHIB from a recent Voyager referral promotion! You really have to wonder how 2021 events will be described in 2030 or 2040. All I can do is listen to the late Jack Bogle and “stay the course”. I remain optimistic that capitalism, human ingenuity, human resilience, human compassion, and our system of laws will continue to improve things over time.

My thought for the quarter is that there is all this focus on tech/crypto/cloud but I hope we still invest enough in physical things like farming/energy/infrastructure.

Performance numbers. According to Personal Capital, my portfolio is up +11.4% for 2021 YTD. I rolled my own benchmark for my portfolio using 50% Vanguard LifeStrategy Growth Fund and 50% Vanguard LifeStrategy Moderate Growth Fund – one is 60/40 and the other is 80/20 so it also works out to 70% stocks and 30% bonds. That benchmark would have a total return of +10.1% for 2021 YTD as of 10/15/2021.

I’ll share about more about the income aspect in a separate post.

My Money Blog has partnered with CardRatings and may receive a commission from card issuers. Some or all of the card offers that appear on this site are from advertisers and may impact how and where card products appear on the site. MyMoneyBlog.com does not include all card companies or all available card offers. All opinions expressed are the author’s alone, and has not been provided nor approved by any of the companies mentioned.

MyMoneyBlog.com is also a member of the Amazon Associate Program, and if you click through to Amazon and make a purchase, I may earn a small commission. Thank you for your support.


Best Interest Rates on Cash – October 2021 Update

My Money Blog has partnered with CardRatings and may receive a commission from card issuers. Some or all of the card offers that appear on this site are from advertisers and may impact how and where card products appear on the site. MyMoneyBlog.com does not include all card companies or all available card offers. All opinions expressed are the author’s alone.

via GIPHY

Here’s my monthly roundup of the best interest rates on cash as of October 2021, roughly sorted from shortest to longest maturities. I look for lesser-known opportunities earning at least double what most savings accounts and money market funds are earning while still keeping your principal FDIC-insured or equivalent. Check out my Ultimate Rate-Chaser Calculator to see how much extra interest you’d earn by moving money between accounts. Rates listed are available to everyone nationwide. Rates checked as of 10/6/2021.

Fintech accounts
Available only to individual investors, fintech companies often pay higher-than-market rates in order to achieve fast short-term growth (often using venture capital). I define “fintech” as a software layer on top of a different bank’s FDIC insurance. These do NOT require a certain number debit card purchases per month. Read about the types of due diligences you should do whenever opening a new bank account.

  • 3% APY on up to $100,000. The top rate is still 3% APY for October through December 2021 (can be 3.5% APY with their credit card), and they have not indicated any upcoming rate drop. HM Bradley requires a recurring direct deposit every month and a savings rate of at least 20%. Due to high demand, you must currently use a referral link to join. If you have any available to share (you get 3), please drop it in the comments of my HM Bradley review.
  • 3% APY on 10% of direct deposits + 1% APY on $25,000. One Finance lets you earn 3% APY on “auto-save” deposits (up to 10% of your direct deposit, up to $1,000 per month). Separately, they also pay 1% APY on up to another $25,000 with direct deposit. New customer $50 bonus via referral. See my One Finance review.
  • 3% APY on up to $15,000. Porte requires a one-time direct deposit of $1,000+ to open a savings account. New customer $50 bonus via referral. Important note: Porte is adding additional restrictions in January 2022. See my Porte review.
  • 1.20% APY on up to $50,000. OnJuno recently updated their rate tiers, while keeping existing customers on the grandfathered 2.15% APY rate. If you don’t maintain a $500 direct deposit each month, you’ll still earn 1.20% on up to $5k. See my updated OnJuno review.

High-yield savings accounts
While the huge megabanks pay essentially no interest, I think every should have a separate, no-fee online savings account to accompany your existing checking account. The interest rates on savings accounts can drop at any time, so I list the top rates as well as competitive rates from banks with a history of competitive rates. Some banks will bait you with a temporary top rate and then lower the rates in the hopes that you are too lazy to leave.

  • T-Mobile Money is still at 1.00% APY with no minimum balance requirements. The main focus is on the 4% APY on your first $3,000 of balances as a qualifying T-mobile customer plus other hoops, but the lesser-known fact is that the 1% APY is available for everyone. Thanks to the readers who helped me understand this. Unfortunately, some readers have reported their applications being denied.
  • Evangelical Christian Credit Union (ECCU) is offering new members 1.01% APY on up to $25,000 when you bundle a High-Yield Money Market Account & Basic Checking. (Existing members can get 0.75% APY.) To join this credit union, you must attest to their statement of faith.
  • There are several other established high-yield savings accounts at closer to 0.50% APY. Marcus by Goldman Sachs is on that list, and if you open a new account with a Marcus referral link (that’s mine), they will give you and the referrer a 0.50% boost on top of the current interest rate for 3 months. You can then extend this by referring others to the same offer. Right now, Marcus is paying 0.50% APY, so with the offer you’d get 1.00% APY currently for your first 3 months.

Short-term guaranteed rates (1 year and under)
A common question is what to do with a big pile of cash that you’re waiting to deploy shortly (plan to buy a house soon, just sold your house, just sold your business, legal settlement, inheritance). My usual advice is to keep things simple and take your time. If not a savings account, then put it in a flexible short-term CD under the FDIC limits until you have a plan.

  • No Penalty CDs offer a fixed interest rate that can never go down, but you can still take out your money (once) without any fees if you want to use it elsewhere. CFG Bank has a 13-month No Penalty CD at 0.62% APY with a $500 minimum deposit. Ally Bank has a 11-month No Penalty CD at 0.50% APY for all balance tiers. Marcus has a 7-month No Penalty CD at 0.45% APY with a $500 minimum deposit. You may wish to open multiple CDs in smaller increments for more flexibility.
  • Lafayette Federal Credit Union has a 12-month CD at 0.80% APY ($500 min). Early withdrawal penalty is 6 months of interest. Anyone can join this credit union via partner organization ($10 one-time fee).

Money market mutual funds + Ultra-short bond ETFs
Many brokerage firms that pay out very little interest on their default cash sweep funds (and keep the difference for themselves). Unfortunately, money market fund rates are very low across the board right now. Ultra-short bond funds are another possible alternative, but they are NOT FDIC-insured and may experience short-term losses at times. These numbers are just for reference, not a recommendation.

  • The default sweep option is the Vanguard Federal Money Market Fund which has an SEC yield of 0.01%. Vanguard Cash Reserves Federal Money Market Fund (formerly Prime Money Market) currently pays 0.01% SEC yield.
  • Vanguard Ultra-Short-Term Bond Fund currently pays 0.27% SEC yield ($3,000 min) and 0.37% SEC Yield ($50,000 min). The average duration is ~1 year, so your principal may vary a little bit.
  • The PIMCO Enhanced Short Maturity Active Bond ETF (MINT) has a 0.22% SEC yield and the iShares Short Maturity Bond ETF (NEAR) has a 0.34% SEC yield while holding a portfolio of investment-grade bonds with an average duration of ~6 months.

Treasury Bills and Ultra-short Treasury ETFs
Another option is to buy individual Treasury bills which come in a variety of maturities from 4-weeks to 52-weeks. You can also invest in ETFs that hold a rotating basket of short-term Treasury Bills for you, while charging a small management fee for doing so. T-bill interest is exempt from state and local income taxes. Right now, this section isn’t very interesting as T-Bills are yielding close to zero!

  • You can build your own T-Bill ladder at TreasuryDirect.gov or via a brokerage account with a bond desk like Vanguard and Fidelity. Here are the current Treasury Bill rates. As of 10/6/2021, a new 4-week T-Bill had the equivalent of 0.04% annualized interest and a 52-week T-Bill had the equivalent of 0.10% annualized interest.
  • The Goldman Sachs Access Treasury 0-1 Year ETF (GBIL) has a -0.06% SEC yield and the SPDR Bloomberg Barclays 1-3 Month T-Bill ETF (BIL) has a -0.09% (!) SEC yield. GBIL appears to have a slightly longer average maturity than BIL.

US Savings Bonds
Series I Savings Bonds offer rates that are linked to inflation and backed by the US government. You must hold them for at least a year. If you redeem them within 5 years there is a penalty of the last 3 months of interest. The annual purchase limit is $10,000 per Social Security Number, available online at TreasuryDirect.gov. You can also buy an additional $5,000 in paper I bonds using your tax refund with IRS Form 8888.

  • “I Bonds” bought between May 2021 and October 2021 will earn a 3.54% rate for the first six months. The rate of the subsequent 6-month period will be based on inflation again. More info here.
  • In mid-October 2021, the CPI will be announced and you will have a short period where you will have a very close estimate of the rate for the next 12 months. I will have another post up at that time, although we already know that it will be likely higher than 5%!
  • See below about EE Bonds as a potential long-term bond alternative.

Prepaid Cards with Attached Savings Accounts
A small subset of prepaid debit cards have an “attached” FDIC-insured savings account with exceptionally high interest rates. The negatives are that balances are severely capped, and there are many fees that you must be careful to avoid (lest they eat up your interest). There is a long list of previous offers that have already disappeared with little notice. I don’t personally recommend nor use any of these anymore, as I feel the work required and risk of messing up exceeds any small potential benefit.

  • Mango Money pays 6% APY on up to $2,500, if you manage to jump through several hoops. Requirements include $1,500+ in “signature” purchases and a minimum balance of $25.00 at the end of the month.

Rewards checking accounts
These unique checking accounts pay above-average interest rates, but with unique risks. You have to jump through certain hoops which usually involve 10+ debit card purchases each cycle, a certain number of ACH/direct deposits, and/or a certain number of logins per month. If you make a mistake (or they judge that you did) you risk earning zero interest for that month. Some folks don’t mind the extra work and attention required, while others would rather not bother. Rates can also drop suddenly, leaving a “bait-and-switch” feeling.

  • The Bank of Denver pays 2.00% APY on up to $25,000 if you make 12 debit card purchases of $5+ each, receive only online statements, and make at least 1 ACH credit or debit transaction per statement cycle. The rate recently dropped. If you meet those qualifications, you can also link a Kasasa savings account that pays 1.00% APY on up to $50k. Thanks to reader Bill for the updated info.
  • Presidential Bank pays 2.25% APY on balances up to $25,000, if you maintain a $500+ direct deposit and at least 7 electronic withdrawals per month (ATM, POS, ACH and Billpay counts).
  • Evansville Teachers Federal Credit Union pays 3.30% APY on up to $20,000. You’ll need at least 15 debit transactions and other requirements every month.
  • Lake Michigan Credit Union pays 3.00% APY on up to $15,000. You’ll need at least 10 debit transactions and other requirements every month.
  • Find a locally-restricted rewards checking account at DepositAccounts.

Certificates of deposit (greater than 1 year)
CDs offer higher rates, but come with an early withdrawal penalty. By finding a bank CD with a reasonable early withdrawal penalty, you can enjoy higher rates but maintain access in a true emergency. Alternatively, consider building a CD ladder of different maturity lengths (ex. 1/2/3/4/5-years) such that you have access to part of the ladder each year, but your blended interest rate is higher than a savings account. When one CD matures, use that money to buy another 5-year CD to keep the ladder going. Some CDs also offer “add-ons” where you can deposit more funds if rates drop.

  • Abound Credit Union has a 59-month Share Certificate at 1.35% APY ($500 min). Early withdrawal penalty is 1 year of interest (and only with the consent of the credit union, so be aware). Anyone can join this credit union via partner organization ($10 one-time fee).
  • NASA Federal Credit Union has a special 49-month Share Certificate at 1.35% APY ($10,000 min of new funds). Early withdrawal penalty is 1 year of interest. Anyone can join this credit union by joining the National Space Society (free). However, NASA FCU will perform a hard credit check as part of new member application.
  • Lafayette Federal Credit Union has a 5-year CD at 1.26% APY ($500 min). Early withdrawal penalty is 6 months of interest. Anyone can join this credit union via partner organization ($10 one-time fee).
  • You can buy certificates of deposit via the bond desks of Vanguard and Fidelity. You may need an account to see the rates. These “brokered CDs” offer FDIC insurance and easy laddering, but they don’t come with predictable early withdrawal penalties. Right now, I see a 5-year CD at 1.10% APY. Be wary of higher rates from callable CDs listed by Fidelity.

Longer-term Instruments
I’d use these with caution due to increased interest rate risk, but I still track them to see the rest of the current yield curve.

  • Willing to lock up your money for 10 years? You can buy long-term certificates of deposit via the bond desks of Vanguard and Fidelity. These “brokered CDs” offer FDIC insurance, but they don’t come with predictable early withdrawal penalties. You might find something that pays more than your other brokerage cash and Treasury options. Right now, I see a 10-year CD at 1.65% APY vs. 1.54% for a 10-year Treasury. Watch out for higher rates from callable CDs from Fidelity.
  • How about two decades? Series EE Savings Bonds are not indexed to inflation, but they have a unique guarantee that the value will double in value in 20 years, which equals a guaranteed return of 3.5% a year. However, if you don’t hold for that long, you’ll be stuck with the normal rate which is quite low (currently 0.10%). I view this as a huge early withdrawal penalty. But if holding for 20 years isn’t an issue, it can also serve as a hedge against prolonged deflation during that time. Purchase limit is $10,000 each calendar year for each Social Security Number. As of 10/6/2021, the 20-year Treasury Bond rate was 2.02%.

All rates were checked as of 9/7/2021.

My Money Blog has partnered with CardRatings and may receive a commission from card issuers. Some or all of the card offers that appear on this site are from advertisers and may impact how and where card products appear on the site. MyMoneyBlog.com does not include all card companies or all available card offers. All opinions expressed are the author’s alone, and has not been provided nor approved by any of the companies mentioned.

MyMoneyBlog.com is also a member of the Amazon Associate Program, and if you click through to Amazon and make a purchase, I may earn a small commission. Thank you for your support.


Vanguard Target Retirement Funds Update: Big Expense Ratio Drop in Early 2022

My Money Blog has partnered with CardRatings and may receive a commission from card issuers. Some or all of the card offers that appear on this site are from advertisers and may impact how and where card products appear on the site. MyMoneyBlog.com does not include all card companies or all available card offers. All opinions expressed are the author’s alone.

I always keep track of the Vanguard Target Retirement 20XX Funds (TRFs) because:

  • They are a low-cost, broadly-diversified, “all-in-one” fund that I believe are a good starting point for both beginning investors and all investors that desire simple effectiveness along with professional management.
  • I have recommended them to my own immediate family, and some of them hold Vanguard TRFs as a significant chunk of their retirement portfolios. I feel a responsibility to make sure they remain solid investments.
  • I view them as an indicator of what Vanguard executives think is the optimal asset allocation mix for most people.

For a while now, one of the primary “cons” of Target Retirement Funds was that it would be much cheaper to buy the individual component ETFs yourself. You could build your own simple portfolio with only three ETFs – VTI (US stocks), VXUS (Global non-US stocks), and BND (US Bonds) at any brokerage firm. Your combined annual expense ratio would be about 0.05% (5 basis points). Yet, the Target Retirement Funds line-up currently charges between 0.12% and 0.15%. You could sign-up for the Vanguard Digital Advisor Services and and only pay 0.20% “all-in” (0.15% for the advice plus 0.05% from ETFs).

Vanguard recently announced they were “streamlining” the Target Retirement Fund line-up and lowering the expense ratio to 0.08% (8 basis points) for each TRF, with an estimated completion date of February 2022. That would be a 47% fee reduction for the stock-heavy TRFs, and a 33% cost reduction for the bond-heavy TRFs. Vanguard estimates $190 million in aggregate savings in 2022 alone as a result of this cost reduction.

As a result, Target Retirement Funds are again safely amongst the cheapest “advised” option for individual investors. By this, I mean that an individual investor decides how much money to put in and an algorithm makes the investment decisions. You don’t have to worry about picking the asset allocation, adjusting as you age, remembering to buy/sell different ETFs every month, enter limit orders, rebalance, and so on. You just send them $100, $500, whatever and it gets put to work. This is essentially the same idea as robo-advisors like Wealthfront, Betterment, and other “guided investing” services. Fidelity and Schwab now also have very low-cost index-based target-date funds.

(If you hold Vanguard TRFs in your 401k or other employer-sponsored tax-deferred account, you may own the institutional shares with an even lower expense ratio.)

There will also be a new fund option, called the Vanguard Target Retirement Income and Growth Fund/Trust. This is a fund designed for those in retirement but would like a higher (50%) stock allocation due to various reasons (greater desire for growth, less need for income). This new option would work well for wealthier investors that don’t need/expect to spend it all down and can thus take on more risk. The default Vanguard Target Retirement Income Fund/Trust will remain with its 30% stock allocation.

Here is the current glide path for Vanguard TRFs. For younger investors, TRFs hold 90% stocks and 10% bonds.

For reference, here is a brief history of the major tweaks to Vanguard Target Retirement fund portfolios:

  • 2003: Target Retirement 20XX Funds are first introduced.
  • 2006: Overall total stock exposure is increased slightly for various Target dates. Emerging markets stocks are added to certain Target dates with longer time horizons.
  • 2010: International stocks as percentage of total stock allocation is increased from 20% to 30%. Three of the underlying funds (European Stock Index, Pacific Stock Index, and Emerging Markets Stock Index) were replaced by a single fund, Vanguard Total International Stock Index Fund.
  • 2013: International bonds are added as 20% of the total bond allocation. Vanguard Short-Term Inflation-Protected Securities Index Fund replaced the Vanguard Inflation-Protected Securities Fund for certain Target dates with shorter time horizons.
  • 2015: International stocks as percentage of total stock allocation increased from 30% to 40%. International bonds as percentage of total bond allocation increased from 20% to 30%.
My Money Blog has partnered with CardRatings and may receive a commission from card issuers. Some or all of the card offers that appear on this site are from advertisers and may impact how and where card products appear on the site. MyMoneyBlog.com does not include all card companies or all available card offers. All opinions expressed are the author’s alone, and has not been provided nor approved by any of the companies mentioned.

MyMoneyBlog.com is also a member of the Amazon Associate Program, and if you click through to Amazon and make a purchase, I may earn a small commission. Thank you for your support.


If Retail Investors Are Dumb Money, Who Is Raking Up All The Alpha?

My Money Blog has partnered with CardRatings and may receive a commission from card issuers. Some or all of the card offers that appear on this site are from advertisers and may impact how and where card products appear on the site. MyMoneyBlog.com does not include all card companies or all available card offers. All opinions expressed are the author’s alone.

Here’s a follow-up to my post about the return gap of retail investors due to poor timing. For every seller of a stock share, there is a buyer. Therefore, if the timing of retail investors is reliably a little worse than average, we also know that someone else is on the other side of all those trades. Is there a group of non-retail investors that is reliably making money off the “dumb money” trades of retail investors?

Larry Swedroe digs into this question in his Advisor Perspectives article The Suckers at the Investment Table:

New research confirms that institutional investors, such as mutual funds, outperform the market before fees, and they do so at the expense of retail investors. That is bad news for retail investors and for investors in active mutual funds, who underperform after fees.

The research finds that the stocks and bonds individual investors buy go on to underperform and the ones they sell go on to outperform – demonstrating that retail investors are “dumb money.”

Unfortunately for fund investors, the same large body of evidence demonstrates that while mutual funds generate gross alpha, their total expenses exceed gross alpha, resulting in negative alphas for their investors.

If on average, an actively-managed mutual fund generates 0.7% of gross alpha, but after you subtract the expense ratio and trading costs which add up to nearly 1%, the net alpha is still negative. The active manager is the winner, taking all of the alpha for themselves in the form of relentless fees taken as a percentage of the entire asset base. The retail investor/customer still loses out. An fairer fee structure would be to take a larger percentage, but of the alpha only.

People will continue to argue about this, but I’m not surprised to see that these studies found alpha. It’s just much, much harder to do than most people think, and that’s exactly why you almost never see a fee structure based on alpha (thought they do exist). Even Charlie Munger, who is famous for his stock-picking skills and disagreement against the “hard” form of Efficient Market Theory, only says that the top 3% to 4% of professional investment managers will outperform (source):

I think it is roughly right that the market is efficient, which makes it very hard to beat merely by being an intelligent investor. But I don’t think it’s totally efficient at all. And the difference between being totally efficient and somewhat efficient leaves an enormous opportunity for people like us to get these unusual records. It’s efficient enough, so it’s hard to have a great investment record. But it’s by no means impossible. Nor is it something that only a very few people can do. The top three or four percent of the investment management world will do fine.

In the end, costs always matter. If you find a genius to pick stocks but they cost more than they help, then you still lose. The only actively-managed mutual funds that I have seriously considered buying are from Vanguard, which improves the odds with substantially lower expense ratios and a history of investor-friendly practices. As a DIY individual investor buying index funds, you can keep your head down and “grind out” reliably above-average returns over time due to the rock-bottom costs. (There, I fit in my own poker reference!) Even as a DIY individual stock investor, as at least I understand what I own and don’t have to pay a 1% management fee every year.

My Money Blog has partnered with CardRatings and may receive a commission from card issuers. Some or all of the card offers that appear on this site are from advertisers and may impact how and where card products appear on the site. MyMoneyBlog.com does not include all card companies or all available card offers. All opinions expressed are the author’s alone, and has not been provided nor approved by any of the companies mentioned.

MyMoneyBlog.com is also a member of the Amazon Associate Program, and if you click through to Amazon and make a purchase, I may earn a small commission. Thank you for your support.


Mind The Gap: How Investor Timing Affects “Real-World” Returns

My Money Blog has partnered with CardRatings and may receive a commission from card issuers. Some or all of the card offers that appear on this site are from advertisers and may impact how and where card products appear on the site. MyMoneyBlog.com does not include all card companies or all available card offers. All opinions expressed are the author’s alone.

Morningstar has released the 2021 update to their annual Mind The Gap study, which measures the gap between reported investment returns (buy and hold throughout the entire period) and investor returns (actual returns experienced due the real-world timing of buy and sell transactions). How well does the average investor time their purchase and sell transactions?

For the 10-year period from 12/31/2010 to 12/31/2020, the average return gap was negative 1.7% annually, with negative gaps across the board:

Investors in US stock funds had a 10-year return gap of negative 1.2% annually. This gap has varied over past rolling 10-year periods, but has been consistently slightly negative:

Now, this is not completely due to performance chasing. Here’s a quick example of how steady dollar-cost averaging may also result in a return gap:

To use a simple example, let’s say an investor puts $1,000 into a fund at the beginning of each year. That fund earns a 10% return the first year, a 10% return the second year, and then suffers a 10% loss in the third year, for a 2.9% annual return over the full three-year period. But the investor’s dollar-weighted return is negative 0.4%, because there was less money in the fund during the first two years of positive returns and more money exposed to the loss during the third year. In this case, there was a 3.3-percentage-point per year gap between the investor’s return (negative 0.4%) and the fund’s (2.9%).

Morningstar ran some extra simulations and DCA does possibly account for some of the gap, but a perfectly-steady DCA investor still outperformed the real-world investor in 6 out of 7 fund categories. DCA can’t be helped if you are simply investing what you can, when you can, but there is still extra trading in and out that appears to only make things worse.

The most boring fund category that includes Target-Date funds has the smallest return gap. Target-date funds are included in the “Allocation” fund category as they include a managed mix of stocks, bonds, and other classes. These funds have the calmest trading activity, and we see that the return gap has been consistently smaller over time:

The fund categories with the most volatile cashflows in and out have the greatest return gaps. Alternative funds and sector equity funds did the worst.

Investing in a low-cost target-date fund (TDF) is easy to dismiss as “too simple” or for the “inexperienced newbies only”, but often the inaction of TDF investors work in their favor. Maybe we should give credit to the humble investors that knows they could do a lot worse by thinking they have skills that they don’t actually have. (Meanwhile, I’m also guilty of thinking that I can do better than a TDF.) From a Bloomberg article using Mind the Gap data from 2015:

But target-date funds have one big advantage over other kinds of mutual funds, the data show. The average mutual fund has a flaw, which is that the average investor hardly ever does as well as his or her funds. Investors tend to jump in and out of funds at the wrong time. They buy high, choosing funds only after they’ve done well. And they sell low, dumping underperforming funds just as they’re about to take off.

targetdategap

My Money Blog has partnered with CardRatings and may receive a commission from card issuers. Some or all of the card offers that appear on this site are from advertisers and may impact how and where card products appear on the site. MyMoneyBlog.com does not include all card companies or all available card offers. All opinions expressed are the author’s alone, and has not been provided nor approved by any of the companies mentioned.

MyMoneyBlog.com is also a member of the Amazon Associate Program, and if you click through to Amazon and make a purchase, I may earn a small commission. Thank you for your support.


Public REITs vs. Private Equity Real Estate Funds: A Performance Comparison

My Money Blog has partnered with CardRatings and may receive a commission from card issuers. Some or all of the card offers that appear on this site are from advertisers and may impact how and where card products appear on the site. MyMoneyBlog.com does not include all card companies or all available card offers. All opinions expressed are the author’s alone.

There are many ways to access real estate as an asset class – publicly-traded REITs like Realty Income, diversified REIT ETFs, private funds that hold baskets of individual properties, and many new fintech varieties. This Institutional Investor article discusses a new research article comparing public REITs and closed-end private equity real estate (PERE) funds:

In a new study published in the Journal of Portfolio Management’s real estate issue, authors Thomas Arnold, David Ling, and Andy Naranjo found that, when compared side-by-side, real estate investment trusts outperformed U.S. closed-end private equity real estate, or PERE, funds by 165 basis points annually.

Here is another Nareit article about the study, where I noticed that the research was actually sponsored by Nareit. Here is a direct link to the study itself.

This other Institutional Investor article points out one of the “benefits” of private real estate funds – namely the fact that they don’t offer accurate daily pricing. You should also consider this a “benefit” of personal homeownership – when things are scary, houses simply don’t sell (instead of giving you a shockingly low price at that moment).

REITs, like any public security, are priced in real time. At the depth of the economic shutdown in March and early April, REIT investors imagined doomsday scenarios as commercial property and hotels sat empty and analysts forecasted that individuals would be unable to make rent payments for the foreseeable future. The price of REITs fell in line with that outlook.

In contrast, private real estate funds use other valuation methods, including appraisals — which depend on property transactions. Back in March and April, no real estate was changing hands to inform these valuations. As a result, the net asset values of private portfolios didn’t reflect the carnage.

Real estate continues to intrigue me, but I’ve always stopped short of directly investing in a rental property because I want to avoid any management responsibility (or even the responsibility hiring a good property manager). To me, rentals are best considered a potentially-lucrative part-time self-employed business opportunity, with the greater upside and downside involved. I also love that I can completely ignore my portfolio for months at a time, and the dividends and interest payments still keep coming in.

I’ve experimented with other options like PeerStreet, Fundrise and others, but the vast majority of my real estate investments are still in the low-cost index ETF VNQ (Vanguard Real Estate ETF). As long as you are good at ignoring the price drops during the scary times, it has been a solid long-term holding. Per Morningstar, here is the growth of $10,000 invested in VNQ since inception 25 years ago (with dividends reinvested!):

My Money Blog has partnered with CardRatings and may receive a commission from card issuers. Some or all of the card offers that appear on this site are from advertisers and may impact how and where card products appear on the site. MyMoneyBlog.com does not include all card companies or all available card offers. All opinions expressed are the author’s alone, and has not been provided nor approved by any of the companies mentioned.

MyMoneyBlog.com is also a member of the Amazon Associate Program, and if you click through to Amazon and make a purchase, I may earn a small commission. Thank you for your support.


Stash Review: Simplified Automated Investing, Improved $80 New Account Bonus, Stock Parties

My Money Blog has partnered with CardRatings and may receive a commission from card issuers. Some or all of the card offers that appear on this site are from advertisers and may impact how and where card products appear on the site. MyMoneyBlog.com does not include all card companies or all available card offers. All opinions expressed are the author’s alone.

Updated with MyPoints promo and Stash Stock Party info. MyPoints has a new Stash promo that has a total value higher than the $20 Stash referral offer. If you don’t already have a MyPoints account, you can first join via this $10 MyPoints referral link to grab an additional $10 upfront bonus. Then log into your MyPoints account and search for “Stash”. Right now, MyPoints is offering 11,000 points (worth $70 in gift cards including Amazon) if you open via their link and deposit at least $5. Stash will give you another $10 as well, for a total bonus of $80. This is a limited-time offer. Their fine print:

*Points will appear as Pending for 32 days.
Must enter valid sign-up information, including bank account information to earn Points.
Offer may only be redeemed once (1) per user.

Original post with full review:

Stash is an investing app targeted that people who want a simple way to build a long-term diversified portfolio, as opposed to day-trading meme stocks, crypto, or high-risk options. All you need is five bucks, a smartphone, and a bank account.

Fee structure and plan features. Stash charges a simple, flat monthly fee. The three plan options are $1/month, $3/month, and $9/month (screenshot below). You make purchases in dollar-based amounts (fractional shares) and there are zero commissions per trade. Each ETFs still has its own underlying expense ratio, as with all brokers.

$1 a month tier (Beginner)

  • Taxable brokerage account and your selected mix of individual stocks and/or ETFs.
  • Automated investing. You choose how much money to direct each month, and all of that money will automatically be fully invested via fractional shares.
  • Stock-Back rewards debit card. If you open an optional bank account (Green Dot Bank), they will issue you a debit card that earns rewards in the form of stock shares. Earn 0.125% stock on all of your everyday purchases, and up to 5% at certain merchants with bonuses.
  • Savings and budgeting tools to help decide the right amount to put aside each month.
  • $1,000 in life insurance.

$3 a month tier (Growth)

  • Everything in the Beginner tier above, plus…
  • Traditional and Roth IRAs are supported.
  • Smart Portfolio. At this higher tier, Stash will help you design a target mix of ETFs that fits your needs.
  • Automatic rebalancing. Stash will automatically monitor and rebalance your portfolio as needed, if it drifts away from your target portfolio.

$9 a month tier (Stash+)

  • Everything in the Beginner and Growth tiers above, plus…
  • Children’s Custodial accounts. Invest in separate UGMA /UTMA account for your children under 18.
  • Double Stock Back. Get special bonuses the Stock-Back® Card and double the rewards you would earn on the regular tier.
  • Automatic rebalancing. Stash will automatically monitor and rebalance your portfolio as needed, if it drifts away from your target portfolio.
  • $10,000 in life insurance.

Stock and ETF trades are executed during four trading windows each weekday. Dividend reinvestment is offered on taxable, IRA, and custodial accounts. Stash Investments LLC is an SEC registered Investment Advisor, which means they are licensed to provide you retirement and investing advice. For me, the relatively low rewards percentage on their Stock Back card is not high enough to make it stand out, especially when compared to the 1% to 2% cash back you can get from other rewards credit cards.

The main draw to this app is the ability to automatically build a portfolio using small, regular amounts. This feels like a descendent of dividend reinvestment plans (DRIPs) where you would send in a check for $25 or $100 and be invested in a company’s stock like ExxonMobil. My great-aunt still gets a check every quarter from ExxonMobil from a DRIP she started decades ago. These days, you can pick nearly any company or group of companies via index ETFs.

Many other stock brokers offer commission-free trades, but the set-and-forget feature where it just sucks money from your bank account every month is very important. You can invest as little as $5 a month, automatically. Of course, this is a crowded field nowadays, and if you had the $1,000 minimum required for a Vanguard Target Retirement mutual fund at Vanguard.com, you could also make automatic additional investments of as little as $1 a month. I would also consider M1 Finance a close competitor.

Sign-up process.

  • Sign up via app or online. Now available on desktop, iOS, and Android.
  • Your personal information (name, address, SSN), same as with all SIPC-insured brokerage accounts.
  • Fill out a short risk questionnaire to help guide you towards an appropriate investment.
  • Pick your investment, which you can change later.
  • Fund with any bank account. Verification can be done via two small test deposits. For many banks, you can expedite the linking process by using your bank login credentials instead.

Stash Parties for free bits of stock. Every few days, the app will notify you of an upcoming “Stash Stock Party“:

By attending a Stash Stock Party, Stashers can get pieces of offered stock(s). The amount of stock depends on the amount of people that attend the Stock Party—the more people that show up, the bigger the split prize pot (and your share of it) ultimately grows. To join a party, just visit this page (party.stash.com) on the party day, log in, and tap Claim stock.

If you log in during their pre-announced short window of time, you can claim a tiny bit of free stock (might only be 10 cents or 30 cents of stock). This is definitely gimmicky, but I realized that it basically covers my a $1 monthly subscription fee, and now I get to watch how these tiny bits of stock can grow over time. They are like little free lottery tickets. If I am not busy, I pick up them up. If I’m busy, no big deal. I have no plans to sell them. Here are some screenshots showing just a portion of my little tiny stock positions:

$20 referral bonus. Right now, if you sign up via a Stash referral link, you can get $20 of free stock (or cash). The standard amount used to be only $5. That is my link, so thanks if you use it! You must open an account, link a bank account, and fund with at least a penny ($0.01) into your new Stash investment or bank account. You don’t need to make a stock purchase, although you certainly can. Screenshot with details:

Bottom line. Stash is a financial app that allows you to gradually and automatically build an investment portfolio using regular purchases of a mix of individual stocks and ETFs. They charge a flat monthly fee starting a $1 per month. Right now, new users can get $20 of free stock to start via referral link.

Also see: Big List of Free Stocks For New Commission-Free Brokerage Apps

My Money Blog has partnered with CardRatings and may receive a commission from card issuers. Some or all of the card offers that appear on this site are from advertisers and may impact how and where card products appear on the site. MyMoneyBlog.com does not include all card companies or all available card offers. All opinions expressed are the author’s alone, and has not been provided nor approved by any of the companies mentioned.

MyMoneyBlog.com is also a member of the Amazon Associate Program, and if you click through to Amazon and make a purchase, I may earn a small commission. Thank you for your support.


Were Vanguard’s 10-Year Stock Market Return Forecasts Accurate? Or Really Wrong?

My Money Blog has partnered with CardRatings and may receive a commission from card issuers. Some or all of the card offers that appear on this site are from advertisers and may impact how and where card products appear on the site. MyMoneyBlog.com does not include all card companies or all available card offers. All opinions expressed are the author’s alone.

Periodically, Vanguard publishes asset class return forecasts for the next 10 years. Here is their most recent one for September 2021. To their credit, they have also published a recent follow-up post tracking both those forecasts alongside the actual returns in retrospect. This is a good lesson on the difficulty of any sort of short-term market prediction, even after allowing yourself 10 years and wide error bars.

Below is a chart tracking their forecasts for the future 10-year average annualized returns of US stocks. Eyeballing their chart, for 2010-2020 their range of confidence was somewhere between roughly 5% and 10% annually, for a median around 7.5%. This accounts for their model’s 25th percentile to 75th percentage range of possible outcomes. This is a pretty big range! $100,000 times 5% annualized returns after 10 years is $163,000. $100,000 times 10% annualized returns after 10 years is $259,000.

Even accounting for that wide range, their forecast for US stocks was off. While the curve looks vaguely similar, US stocks did significantly better than their forecast:

Again, even accounting for the huge range of guesses, their forecast for international stocks was also off. Global non-US stocks did significantly worse than their forecast:

Vanguard’s original chart focuses on their 60/40 portfolio, which happens to look a lot better. Why? Their 60/40 portfolio consists of 36% US equities, 24% global ex-US equities, 28% US bonds, and 12% ex-US bonds. For one, future bond returns are much more simple to predict than stock returns. Your current 10-year yield is going to be pretty close to your eventual 10-year return. In addition, their US equities forecast was really wrong in one direction (too low), while their international equity forecast was wrong in the other direction (too high), so they tended to offset each other. Is this diversification in action? Certainly, yes, but also luck in my opinion. Both could have also been wrong in the same direction.

Should we just ignore this stuff completely then? I keep thinking back to this illuminating chart comparing the contributions of earnings growth, dividends, and P/E ratio changes to the total return of the S&P 500. Earnings growth and dividends have been pretty consistent for over 70 years, but the overall swings in return have been mostly caused by P/E ratio expansion and contraction.

Consider the analogy that P/E ratio expansion and contraction behaves like a rubber band. It can stretch pretty far, much farther than you might expect, but as you keep stretching it, the stronger it will eventually want to come back. But you never really know how far it can stretch, or when it will snap back. Forecasts can be wrong for a long, long time. You have to balance knowing that the run will end eventually, but not knowing when. Someone will always be right in retrospect.

If only we could focus solely on the earnings growth and dividends. Those are what really matter in the long run. This is the behavioral benefit of remembering that dividends are a share of profits being distributed to you as a business owner. Even if prices on a screen are dropping, the businesses are still working hard, making profits, reinvesting some for more earnings growth, and sending some of it to you as cash.

My Money Blog has partnered with CardRatings and may receive a commission from card issuers. Some or all of the card offers that appear on this site are from advertisers and may impact how and where card products appear on the site. MyMoneyBlog.com does not include all card companies or all available card offers. All opinions expressed are the author’s alone, and has not been provided nor approved by any of the companies mentioned.

MyMoneyBlog.com is also a member of the Amazon Associate Program, and if you click through to Amazon and make a purchase, I may earn a small commission. Thank you for your support.


Reader Question: Should I Buy Savings Bonds in September/October 2021 or November 2021?

My Money Blog has partnered with CardRatings and may receive a commission from card issuers. Some or all of the card offers that appear on this site are from advertisers and may impact how and where card products appear on the site. MyMoneyBlog.com does not include all card companies or all available card offers. All opinions expressed are the author’s alone.

sb_poster

Here’s a timely reader question about Series I Bonds. It’s a good question because I predict that Series I Bonds will be soon getting even more media attention soon due to an even higher inflation-linked rate.

Would it be best to wait till November 1st to purchase I bonds? You mentioned the fixed rate will probably confine at 0. but what about the semiannual inflation rate? Do u think it is likely to be more than 3.54%? I’m new to this please educate me.

Series I Bond rates react every 6 months to delayed inflation reports from the Bureau of Labor Statistics. August CPI-U was already reported in mid-September, and September CPI-U will be reported in mid-October. 5 out of 6 months of data are already in the books, leaving only one month of data left. The 12-month trailing inflation rate as of that August CPI-U update was over 5%. Therefore, unless that data contains a significant amount of deflation, we already know that the next inflation rate on Series I Bonds is going to be higher than the 3.54% from May to October 2021. I roughly estimate the range that the next inflation rate will be between as 5% to 7%. That should be enough accuracy to make a purchase timing decision, earlier than my usual practice of waiting until mid-October.

  • If you buy in September or October 2021, you will receive a total rate of 3.54% for the first six months, then the “new” (estimated 5%-7%) rate for the next 6 months, and then new rates adjusted every six months for inflation onward.
  • If you buy in November 2021, you will receive the “new” (estimated 5%-7%) rate for the first 6 months, and then new rates adjusted every six months for inflation onward.

The takeaway is that either way, you will earn the “new” rate (estimated 5%-7%) eventually. If you buy in September/October, you’ll just have to wait a bit due to the staggered structure. Given that the current rate of 3.54% is still a higher interest rate than nearly any other savings account or CD is paying, I would personally just invest now if I had the cash ready and waiting. Also remember that Series I Bonds do not allow early withdrawals within the first 12 months after purchase date. As long as you complete your purchase by the end of September, it will count as purchased in September 2021 and you will be able to withdraw as of September 1st, 2022 (though subject to a penalty if held less than 5 years). It may take a little bit to set up your TreasuryDirect account, and it may take a couple business days for the withdrawal and purchase to process, so I wouldn’t wait until the last day.

Annual purchase limits. The annual purchase limit is now $10,000 in online I-bonds per Social Security Number. For a couple, that’s $20,000 per year. You can only buy online at TreasuryDirect.gov, after making sure you’re okay with their security protocols and user-friendliness. You can also buy an additional $5,000 in paper I bonds using your tax refund with IRS Form 8888. If you have children, you may be able to buy additional savings bonds by using a minor’s Social Security Number.

As noted in my previous savings bond posts, these Series I bonds are a unique investment opportunity in that they are only available to individuals and are subject to purchase limits. Even if the real yield (fixed rate) is set at zero, that is still significantly higher than that of TIPS that trade on the open market (well negative across the board!). If institutional investors like pension funds or endowments could buy I bonds like you and me, they would buying billions of them.

I plan to purchase up to my annual purchase limit for 2021 as part of my asset allocation to inflation-linked bonds, although you can start with as little as $25. I guarantee that there will be many more articles about Series I bonds in mainstream personal finance sites in November after the new rate is officially announced.

My Money Blog has partnered with CardRatings and may receive a commission from card issuers. Some or all of the card offers that appear on this site are from advertisers and may impact how and where card products appear on the site. MyMoneyBlog.com does not include all card companies or all available card offers. All opinions expressed are the author’s alone, and has not been provided nor approved by any of the companies mentioned.

MyMoneyBlog.com is also a member of the Amazon Associate Program, and if you click through to Amazon and make a purchase, I may earn a small commission. Thank you for your support.