Vanguard ETF & Mutual Fund Expense Ratio Drops (February 2025)

My Money Blog has partnered with CardRatings and may receive a commission from card issuers. Some or all of the card offers that appear on this site are from advertisers and may impact how and where card products appear on the site. MyMoneyBlog.com does not include all card companies or all available card offers. All opinions expressed are the author’s alone.

It’s been a while since Vanguard announced a big round of expense ratio cuts, and just in time for their upcoming 50th anniversary, they announced what they call the largest fee cut in Vanguard history spanning 87 funds and projected to save fundholders $350 million this year (effective 2/1/25). In this regard, I am not worried about Vanguard. They know that low costs are core to their identity.

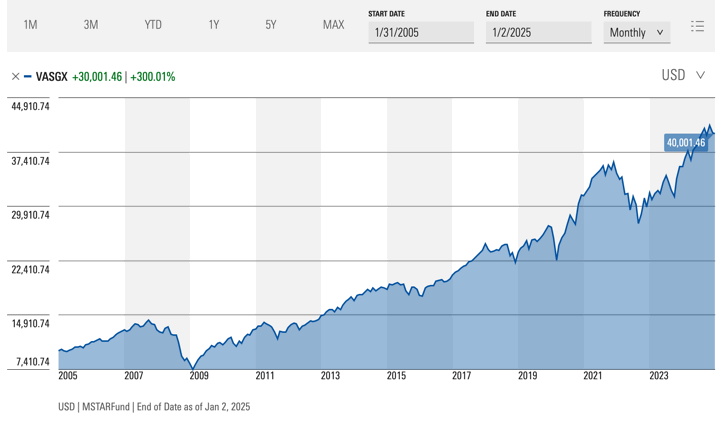
At Vanguard, we believe our funds’ impressive long-term performance owes much to their low costs. For the 10 years ended December 31, 2024, 84% of our funds outpaced the average results of competing funds. The performance of our actively managed fixed income funds has been especially strong: 91% of our active bond funds and 100% of our money market funds have outpaced their peers’ average results.

In fact, I worry that they focus on low costs too much. Cuts are nice, but these expense ratio cuts mean probably 0.01% for the average investor, or $1 a year per $10,000 invested. I’d much rather Vanguard keep the 0.01% and spend it on maintaining a highly-trained, long-tenured staff. There is a palpable difference when talking with a typical Fidelity employee vs. Vanguard employee. I think Vanguard is heading in the right direction, but their staffing still feels much less experienced.

Here are the largest funds and ETFs with expense ratio drops:

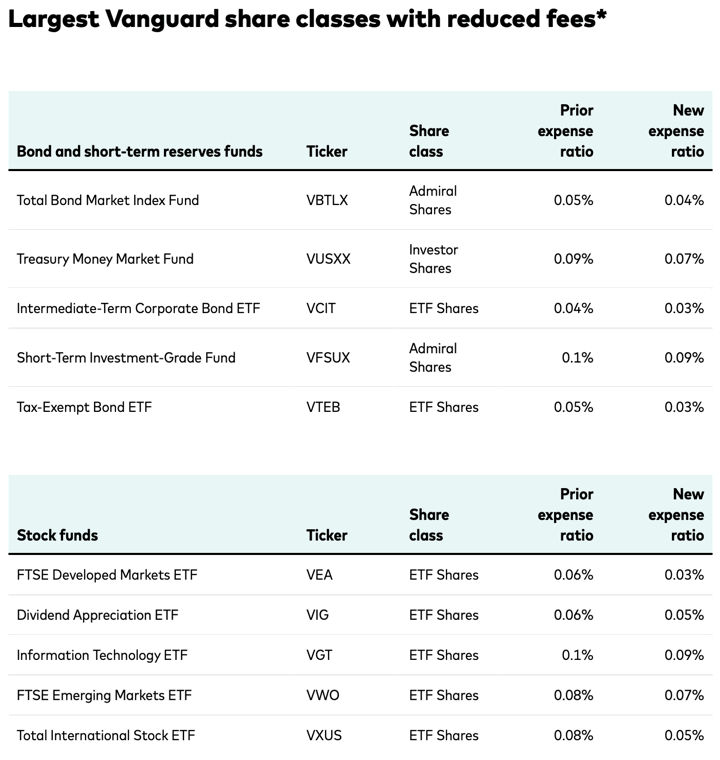
I would point out that the ETF version of some of the mutual funds are still slightly cheaper. For example, BND is at 0.03% while VBTLX went from 0.05% to 0.04%. Again, small margins, but you can hold Vanguard ETFs easily at any brokerage and I like that optionality.

Here are a limited sample of funds that I have held in the past that were affected:

  • Vanguard Total International Stock Market (VXUS) lowered to 0.05%.
  • Vanguard Treasury Money Market Fund (VUSXX) lowered to 0.07%.
  • Vanguard California Municipal Money Market Fund (VCTXX) lowered to 0.12%.
  • Vanguard Intermediate-Term Treasury ETF (VGIT) lowered to 0.03%.
  • Vanguard FTSE Emerging Markets ETF (VWO) lowered to 0.07%.
  • Vanguard FTSE All-World ex-US ETF (VEU) lowered to 0.04%.

Here are the current expense ratios on the four broadest ETFs + their classic S&P 500 ETF:

  • Vanguard Total US Stock Market (VTI) at 0.03%.
  • Vanguard Total International Stock Market (VXUS) at 0.05%.
  • Vanguard Total US Bond Market (BND) at 0.03%.
  • Vanguard Total International Bond (BNDX) at 0.07%.
  • Vanguard 500 Index (VOO) at 0.03%.

I find it interesting that one of the last places where the “Vanguard Effect” hasn’t shown up is in money market funds. They still have consistently the best and cheapest default cash sweep money market funds, Treasury money market funds, and Municipal money market funds. They also have some of the best muni funds in general. They are expanding their bond ETFs, but for now access to these alone is a strong reason to stay with Vanguard as a brokerage if you are DIY investor.

My Money Blog has partnered with CardRatings and may receive a commission from card issuers. Some or all of the card offers that appear on this site are from advertisers and may impact how and where card products appear on the site. MyMoneyBlog.com does not include all card companies or all available card offers. All opinions expressed are the author’s alone, and has not been provided nor approved by any of the companies mentioned.

MyMoneyBlog.com is also a member of the Amazon Associate Program, and if you click through to Amazon and make a purchase, I may earn a small commission. Thank you for your support.


Vanguard 10-Year Stock Market Forecasts 2025-2035 (+Retrospective)

My Money Blog has partnered with CardRatings and may receive a commission from card issuers. Some or all of the card offers that appear on this site are from advertisers and may impact how and where card products appear on the site. MyMoneyBlog.com does not include all card companies or all available card offers. All opinions expressed are the author’s alone.

Vanguard recently released their most recent annual 10-year forecast as of mid-November 2024 (effectively the beginning of 2025). The beginning of the year is the time for forecasts, and that also makes it a good time to remind ourselves how badly they can be wrong and how you shouldn’t really use them for anything.

Let’s look back at how those same forecasts performed from 2011-2021, with confidence ranges within the 25th and 75th percentiles. I have some old images saved from when Vanguard gave us an update in 2021.

For US Stocks between 2011-2021, their forecast in 2011 was roughly between 6% and 12% annually for US stocks, for a median around 9%. That a wide band! The actual return? 13.4%. As of early 2025, we are still outside their confidence bands.

For Global ex-US Stocks between 2011-2021, their forecast in 2011 was roughly between 6% and 11% annually for US stocks, for a median around 8.5%. The actual return? 4.0%. As of early 2025, we are still outside their confidence bands here as well.

I’m not trying to pick on Vanguard here, but they do release these things with a certain degree of seriousness and brand authority. But honestly, I wish they wouldn’t. I mean, sooner or later they’ll be correct, but how could you possibly attribute that to skill and not luck?

I’m going to include a copy of their late 2024 10-year forecasts (close to the start of 2025) here because they usually delete the post after a couple of years. This way, we can look back again in the future. For this chart, the ranges are their median forecast with a fixed 2% range of confidence for stocks and 1% range for bonds.

Notably, the 10-year median return forecast is 3.8% for US stocks, 7.9% for Global ex-US stocks, and 4.8% for US total bond. This table includes their percentile confidence ranges.

This all reminds of me of the old joke: How can you tell economists have a sense of humor? They use decimal points.

My Money Blog has partnered with CardRatings and may receive a commission from card issuers. Some or all of the card offers that appear on this site are from advertisers and may impact how and where card products appear on the site. MyMoneyBlog.com does not include all card companies or all available card offers. All opinions expressed are the author’s alone, and has not been provided nor approved by any of the companies mentioned.

MyMoneyBlog.com is also a member of the Amazon Associate Program, and if you click through to Amazon and make a purchase, I may earn a small commission. Thank you for your support.


Vanguard Thoughts: After 23 Years, Should I Stay or Switch to Fidelity/Schwab?

My Money Blog has partnered with CardRatings and may receive a commission from card issuers. Some or all of the card offers that appear on this site are from advertisers and may impact how and where card products appear on the site. MyMoneyBlog.com does not include all card companies or all available card offers. All opinions expressed are the author’s alone.

I’ve been a Vanguard customer (ahem, owner) for 23 years now. As such, I’ve also been one of those long-time customers that has been disappointed to see their struggles with customer service for their individual retail brokerage clients. One of my big decisions in 2024 was if I would move the majority of my assets to Fidelity or Schwab. Here’s another long-winded post about my thoughts about Vanguard.

Jack Bogle made a powerful decision when he created the Vanguard ownership structure. Each of the mutual funds was its own entity, and the shareholders own the funds. In turn, the member funds own the umbrella Vanguard Group. The member funds each pay their own expenses for research, management, etc. Everything is “at-cost”. There are no outside shareholders that may call for profits to put aside or dividends to be paid out to them. In theory, this means that the goals of each individual retail investor are aligned with the Vanguard executives.

However, in practice, we are entirely passive shareholders in that we have no vote over who is CEO, who is on the Board of Director, how much each of those folks gets paid (we don’t even get to see the actual number), whether the company should prioritize customer service or growth of assets or employee benefits. As with many large non-profits, the executives at Vanguard get very large compensation packages and the target is almost always growth, growth, growth. Bigger is better; more assets means the executives can justify a larger paycheck.

When I started with Vanguard, they were much smaller and there was more “fat” in the system. Their expense ratio for the flagship S&P 500 index fund something like 0.20% annually ($20 a year for every $10,000 invested). ETFs did not exist, and mutual funds usually charged users a transaction fee unless they were on a “mutual fund supermarket” with a pay-to-play structure. In turn, this made mutual funds more expensive because they passed the costs onto the customer. Vanguard refused to pay kickbacks because that would increase the costs to shareholders, so us retail investors had to go “direct” to Vanguard to get access with no transaction fees. The cheapest option was to go direct with Vanguard, and they had a “cheap and cheerful” reputation. They weren’t the best in customer service, but phone calls were answered promptly.

Then came the exchange-traded fund (ETF). ETFs were cheaper to maintain for Vanguard (and everyone else). This drove costs even lower. ETFs could be bought and sold at any brokerage with the same transaction costs as a stock. ETFs also had inherent tax-advantages that made it much easier to avoid creating capital gains distributions. I believe a big break happened when Vanguard stopped holding the mutual fund and ETF expense ratios at the exact same level. Everyone was incentivized further to hold the ETF version.

Today, the expense ratio for the flagship S&P 500 index mutual fund is only 0.04% annually ($4 a year for every $10,000 invested). But the ETF version is only 0.03% annually ($3 a year for every $10,000 invested). There are both certainly much cheaper than 20 years ago, but today each of their ETFs also has at least two other competitors at the same low expense ratio. Vanguard probably feels forced to keep their ETF costs as low as possible, lest they hurt their “low-cost” brand.

However, since each Vanguard fund has to pay for its own expenses including customer service costs, Vanguard is now incentivized to have you hold your ETF at another brokerage. (And once you start holding Vanguard ETFs in another brokerage, technically you should be rooting for lower costs and thus Vanguard to spend less on customer service as well.) Trades are zero now everywhere. But every single customer service call still has to be paid for somehow, and from this perspective, you can begin to understand why their customer service has gone downhill. Their margins are purposefully thin and the only solutions are to either raise their expense ratios a tiny bit (slower growth and perhaps lower executive salaries) or just try to keep spending as little as possible on customer service.

Guess which one they picked? From WSJ article (gift) Vanguard’s Die-Hard Customers Have a Message for New CEO: ‘The Service Is Abysmal’:

Brokerage-account customers were also recently warned that “excessive reliance on phone associates” could lead to additional fees or account termination.

Importantly, Vanguard has limited ways to subsidize the low costs of their ETFs. Meanwhile, Fidelity still makes a ton of money upselling customers to a variety of wealth management services. Schwab earns hundreds of millions extra by quietly paying nearly zero interest on their cash sweep (they recently dropped it to 0.05% APY in December 2024), pocketing an average of 2% to 3% annually on their customer’s idle cash. Robinhood lets me trade random crypto 24/7 and promotes active trading which results in an insane amount of payment for order flow.

Is this the natural end for Vanguard? Will they just make the commodity product and let others distribute it and deal with customers?

This is why the new CEO will undoubtedly have a big focus on low-cost wealth management. This will allow them to charge customers a higher fee for increased financial advice and customer service. They would finally have something to upsell. The only other alternative is for them to raise Vanguard brokerage fees so that the retail customers pay directly for the additional services they require.

In the end, I asked myself, “If something happens to me, would I rather have my wife deal with Vanguard, Fidelity, or Schwab?” She may end up wanting to pay for extra assistance and advice. Vanguard would have the worst customer service, but perhaps they will come up with a reasonable-cost advisory system. Fidelity and Schwab would undoubtedly be happy to provide her additional financial advice as well, likely at a higher price. Fidelity has solid customer service in my opinion, but I don’t really like their wealth management options based on my past experiences helping older relatives. Schwab has a conveniently-located physical branch near us, but I have a bad taste in my mouth after their “Intelligent Portfolios” zero-interest-cash-is-good-for-you fiasco. (See CBNC article Charles Schwab to pay $187 million to settle SEC charges that it misled robo-advisor clients on fees.)

In the end, I have punted my decision and only made some smaller moves. I transferred our Vanguard IRA assets over to Robinhood as a 5-year test run (in exchange for $16,000). I already have my Solo 401k and an active Cash Management Account at Fidelity. Perhaps Vanguard will shore up their customer service to “decent enough” and use AI to create a at-cost/low-cost advisory platform for the masses. Perhaps the Fidelity model of solid customer service plus a whole bunch of both low-cost and higher-cost menu items is the best one. Perhaps I will place the highest value on a local Schwab human rep.

Image credit: Canva AI generated with prompt “HMS Vanguard in rough seas”

My Money Blog has partnered with CardRatings and may receive a commission from card issuers. Some or all of the card offers that appear on this site are from advertisers and may impact how and where card products appear on the site. MyMoneyBlog.com does not include all card companies or all available card offers. All opinions expressed are the author’s alone, and has not been provided nor approved by any of the companies mentioned.

MyMoneyBlog.com is also a member of the Amazon Associate Program, and if you click through to Amazon and make a purchase, I may earn a small commission. Thank you for your support.


MMB Portfolio Dividend & Interest Income – 2024 Year-End Update

My Money Blog has partnered with CardRatings and may receive a commission from card issuers. Some or all of the card offers that appear on this site are from advertisers and may impact how and where card products appear on the site. MyMoneyBlog.com does not include all card companies or all available card offers. All opinions expressed are the author’s alone.

Here’s my 2024 Year End income update as a companion post to my 2024 Year End asset allocation & performance update. Even though I don’t focus only on high-dividend stocks, income-focused ETFs or high-yield bonds – I consider myself focused on total return) – I still track the income from my portfolio as an alternative metric to performance. The total income goes up much more gradually and consistently than the number shown on brokerage statements (market price), which helps encourage consistent investing. Here’s a related quote from Jack Bogle (source):

The true investor will do better if he forgets about the stock market and pays attention to his dividend returns and to the operating results of his companies. – Jack Bogle

Here is the historical growth of the S&P 500 total dividend, which tracks roughly the largest 500 stocks in the US, updated after 2024 Q4 (via Yardeni Research):

Why I like tracking dividends in general. Stock dividends are a portion of profits that businesses have decided to distribute directly to shareholders, as opposed to reinvesting into their business, paying back debt, or buying back shares. They have explicitly decided that they don’t need this money to improve their business, and that it would be better to distribute it to shareholders. The dividends may suffer some short-term drops, but over the long run they have grown faster than inflation.

In the US, the dividend culture is somewhat conservative in that shareholders expect dividends to be stable and only go up. Thus the starting yield is lower, but grows more steadily with smaller cuts during hard times. Companies do buybacks as well, often because they are easier to discontinue. Here is the historical growth of the trailing 12-month (ttm) dividend paid by the Vanguard Total US Stock ETF (VTI) via StockAnalysis.com.

European corporate culture tends to encourage paying out a higher (sometimes fixed) percentage of earnings as dividends, but that also means the dividends move up and down with earnings. The starting yield is currently higher but may not grow as reliably. Here is the historical growth of the trailing 12-month (ttm) dividend paid by the Vanguard Total International Stock ETF (VXUS).

The dividend yield (dividends divided by price) also serve as a rough valuation metric. When stock prices drop, this percentage metric usually goes up – which makes me feel better in a bear market. When stock prices go up, this percentage metric usually goes down, which keeps me from getting too euphoric during a bull market.

In the case of REITs, they are legally required to distribute at least 90 percent of their taxable income to shareholders as dividends. Historically, about half of the total return from REITs is from this dividend income.

Finally, the last component comes from interest from bonds and cash. This will obviously vary with the prevailing interest rates, the real rates on TIPS, and the current rate of inflation. In 2024, we are finally back to getting paid a certain amount more than inflation on our cash.

Dividend and interest income from my specific asset allocation. To estimate the income from my portfolio, I use the weighted “TTM” or “12-Month Yield” from Morningstar (checked 1/5/24), which is the sum of the trailing 12 months of interest and dividend payments divided by the last month’s ending share price (NAV) plus any capital gains distributed (usually zero for index funds) over the same period. My TTM portfolio yield is now roughly 2.55%.

As you can see from my total annual income tracker, my total income from this portfolio has been mostly steady since mid-2022 (when interest rates started to rise again). Again, this keeps me from getting too euphoric from the market’s gains. A lot of it is just P/E ratio expansion, which can just as easily be followed by P/E ratio contraction.

What about the 4% rule? For big-picture purposes, I support the simple 4% or 3% rule of thumb, which equates to a target of accumulating roughly 25 to 33 times your annual expenses. I would lean towards a 3% withdrawal rate if you want to retire young (closer to age 50) and a 4% withdrawal rate if retiring at a more traditional age (closer to 65). Too much time is spent debating this number. It’s just a quick and dirty target to get you started, not a number sent down from the heavens! You will always have time to adjust later.

During the accumulation stage, your time is better spent focusing on earning potential via better career moves, improving your skillset, networking, and/or looking for asymmetrical entrepreneurial opportunities where you have an ownership interest.

Our dividends and interest income are not automatically reinvested. They are simply another “paycheck”. As with our other variable paychecks, we can choose to either spend it or invest it again to compound things more quickly. You could use this money to cut back working hours, pursue a different career path, start a new business, take a sabbatical, perform charity or volunteer work, and so on. You don’t have to wait until you hit a magic number. FIRE is Life!

My Money Blog has partnered with CardRatings and may receive a commission from card issuers. Some or all of the card offers that appear on this site are from advertisers and may impact how and where card products appear on the site. MyMoneyBlog.com does not include all card companies or all available card offers. All opinions expressed are the author’s alone, and has not been provided nor approved by any of the companies mentioned.

MyMoneyBlog.com is also a member of the Amazon Associate Program, and if you click through to Amazon and make a purchase, I may earn a small commission. Thank you for your support.


MMB Portfolio: Should I Own Less International Stocks? (2024 Year End)

My Money Blog has partnered with CardRatings and may receive a commission from card issuers. Some or all of the card offers that appear on this site are from advertisers and may impact how and where card products appear on the site. MyMoneyBlog.com does not include all card companies or all available card offers. All opinions expressed are the author’s alone.

The most common reader question about my personal portfolio is definitely the fact that the allocation to international stocks has been a drag on performance relative to owning 100% US stocks. This is kind of a repeat topic, so I won’t dive into the full debate again, but wanted to offer some expanded and updated thoughts to my response to a comment from reader John. All numbers below are taken as of January 2025.

The divergence between the performance of US stocks and the rest of the world started around 2009, which of course coincided with most of my investing lifetime so far. 😒 Here’s a chart from the Bloomberg article Global Diversification Has Disappointed. Don’t Give Up on It (gift article for next 7 days). Worth a read.

As noted in my portfolio updates, my asset allocation floats along with total world market cap breakdown, as tracked according to the Vanguard Total World Stock ETF (VT). I remember a time when it was only 45% US and 55% Rest of the World (World ex-US). As of the end of 2024, it is now at 65% US and 35% World ex-US.

In practical terms, this means that I used to own about the same amount of Vanguard Total US Stock Market ETF (VTI) and Vanguard Total International Stock ETF (VXUS), a 1:1 ratio. But as of the end of 2024, I now own about double the amount of VTI relative to VXUS, a 2:1 ratio. So my performance isn’t exactly that of the chart above due to ongoing investments over time, but it’s still been much lower than if I used owned 100% US stocks.

I can’t change the past. The question is: Should I change my asset allocation now?

Let’s look closer. A significant chunk (not all) of the outperformance has been due to a higher P/E ratio. Below is a Yardeni chart of the P/E ratio of US stocks vs. International stocks. The gap looks like the greatest in 25 years. Can this trend continue? I don’t know, and I don’t think anyone really knows.

Are US stocks simply a better investment, forever? They might be. The US definitely offers a very business-friendly environment overall. That’s why I just let it float. If the US manages to continue this outperformance in the future, then one day my allocation might grow to 75%/25% (3:1 ratio) or even 80%/20% (4:1 ratio). My portfolio adjusts.

This is the same theory as owning all of the companies in a market-weighted S&P 500 index fund: you own all the winners, and you also own the losers, but owning the winners is good enough to pull everything up overall. If the US keeps being a huge winner, I’ll own a lot of the US. If not, I still own the entire haystack. Therefore, I plan to continue holding a chunk of international stocks according to the investable market-cap float with maybe a slight home bias.

I could sit here and lament how big my portfolio would have been if I had bet on 100% US for the last 15 years, but honestly the stock markets have been kind to me as a business owner (although I’d say at the expense of the average worker bee) even with my international stocks and bond holdings. The 10-year trailing average annualized return has been 9.33% for VT vs. 12.50% for VTI. Owning a mix of winners and losers has still worked out just fine, and I was covered in case history turned out differently. I have no complaints.

Photo by Andrew Neel on Unsplash

My Money Blog has partnered with CardRatings and may receive a commission from card issuers. Some or all of the card offers that appear on this site are from advertisers and may impact how and where card products appear on the site. MyMoneyBlog.com does not include all card companies or all available card offers. All opinions expressed are the author’s alone, and has not been provided nor approved by any of the companies mentioned.

MyMoneyBlog.com is also a member of the Amazon Associate Program, and if you click through to Amazon and make a purchase, I may earn a small commission. Thank you for your support.


MMB Portfolio Asset Allocation & Performance – 2024 Year-End Update

My Money Blog has partnered with CardRatings and may receive a commission from card issuers. Some or all of the card offers that appear on this site are from advertisers and may impact how and where card products appear on the site. MyMoneyBlog.com does not include all card companies or all available card offers. All opinions expressed are the author’s alone.

Here’s my Year End 2024 update for our primary investment holdings, including all of our combined 401k/403b/IRAs and taxable brokerage accounts but excluding our house and side portfolio of self-directed investments. Following the concept of skin in the game, the following is not a recommendation, but a sharing of our real-world, imperfect, low-cost, diversified DIY portfolio.

“Never ask anyone for their opinion, forecast, or recommendation. Just ask them what they have in their portfolio.” – Nassim Taleb

How I Track My Portfolio
Here’s how I track my portfolio across multiple brokers and account types. There are limited free advanced options after Morningstar discontinued free access to their portfolio tracker. I use both Empower Personal Dashboard (previously known as Personal Capital) and a custom Google Spreadsheet to track my investment holdings:

  • The Empower Personal Dashboard real-time portfolio tracking tools (free) automatically logs into my different accounts, adds up my various balances, tracks my performance, and calculates my overall asset allocation daily. Formerly known as Personal Capital.
  • Once a quarter, I also update my manual Google Spreadsheet (free to copy, instructions) because it helps me calculate how much I need in each asset class to rebalance back towards my target asset allocation. I also create a new tab each quarter, so I have a personal archive of my holdings dating back many years.

2024 Year End Asset Allocation and YTD Performance
Here are updated performance and asset allocation charts, per the “Holdings” and “Allocation” tabs of my Empower Personal Dashboard.

I own broad, low-cost exposure to productive assets that will provide long-term returns above inflation, distribute income via dividends and interest, and offer some historical tendencies to balance each other out. I have faith in the long-term benefit of owning all of the best businesses worldwide, as well as the stability of high-quality US Treasury debt.

I let my stock holdings float relatively close to the total world market cap breakdown, and it is now at ~65% US and ~35% ex-US. I do add just a little “spice” to the broad funds with the inclusion of “small value” factor ETFs for US and Developed International stocks as well as diversified real estate exposure through US REITs. But if you step back and look at the big picture, this is my simplified target portfolio:

By paying minimal costs including management fees, transaction spreads, and tax drag, I am trying to essentially guarantee myself above-average net performance over time.

The portfolio that you can hold onto through the tough times is the best one for you. Every asset class will eventually have a low period, and you must have strong faith during these periods to earn those historically high returns. You have to keep owning and buying more stocks through the stock market crashes. You have to maintain and even buy more rental properties during a housing crunch, etc. A good sign is that if prices drop, you’ll want to buy more of that asset instead of less. I don’t have strong faith in the long-term results of commodities, gold, or bitcoin – so I don’t own them.

I do not spend a lot of time backtesting various model portfolios, as I don’t think picking through the details of the recent past will necessarily create superior future returns. You’ll usually find that whatever model portfolio is popular at the moment just happens to hold the asset class that has been the hottest recently as well.

I have settled into a long-term target ratio of roughly 70% stocks and 30% bonds within our investment strategy of buy, hold, and occasionally rebalance. My goal has evolved to more of a “perpetual income portfolio” as opposed to a “build up a big stash and hope it lasts until I die” portfolio. My target withdrawal rate is 3% or less. Here is a round-number breakdown of my target asset allocation along with my primary ETF holding for each asset class.

  • 35% US Total Market (VTI)
  • 5% US Small-Cap Value (VBR/AVUV)
  • 20% International Total Market (VXUS)
  • 5% International Small-Cap Value (AVDV)
  • 5% US Real Estate (REIT) (VNQ)
  • 15% US “Regular” Treasury Bonds or FDIC-insured deposits
  • 15% US Treasury Inflation-Protected Bonds or I Savings Bonds

I do let things wobble a bit so I don’t have to keep rebalancing. Also, I have limited tax-deferred space for TIPS so I own less than I might otherwise. So the bonds is closer to 20% Treasuries and 10% TIPS.

Performance details. According to Empower, my portfolio went up around 11.5% in 2024. The S&P 500 went up 23.3% in 2024, while the US Bond index went up around 1.3%. Another year of relative underperformance in international stocks in the books.

Overall, we spent some of our dividends/interest and also made some 401k/IRA contributions with income to take advantage of tax-deferred opportunities. We no longer have the crazy savings rate of our 20s and 30s. Owning stocks continues to reward long-term investors. Out of curiosity, I generated a Morningstar Growth of $10,000 Chart for the Vanguard LifeStrategy Growth Fund (VASGX) which holds a static 80% stocks and 20% bonds and most closely mimics my portfolio since 2005, roughly when I started investing more seriously and started this blog. A very rough approximation is to expect your money to double every decade (Rule of 72). The money that I invested 20 years ago has indeed roughly doubled twice (4X).

I’ll share about more about the income aspect in a separate post.

My Money Blog has partnered with CardRatings and may receive a commission from card issuers. Some or all of the card offers that appear on this site are from advertisers and may impact how and where card products appear on the site. MyMoneyBlog.com does not include all card companies or all available card offers. All opinions expressed are the author’s alone, and has not been provided nor approved by any of the companies mentioned.

MyMoneyBlog.com is also a member of the Amazon Associate Program, and if you click through to Amazon and make a purchase, I may earn a small commission. Thank you for your support.


2024 Year-End Review: Annual Broad Asset Class & Target Fund Returns

My Money Blog has partnered with CardRatings and may receive a commission from card issuers. Some or all of the card offers that appear on this site are from advertisers and may impact how and where card products appear on the site. MyMoneyBlog.com does not include all card companies or all available card offers. All opinions expressed are the author’s alone.

Happy New Year! 🎉 🥳 Let’s see how the year went for the broad asset classes that I track. Per Morningstar, here are the total annual returns (includes price appreciation and dividends/interest) for select asset classes as benchmarked by popular ETFs after market close 12/31/24.

I didn’t include Bitcoin or any other crypto because I honestly don’t track it, don’t own it as part of my long-term portfolio, and would not advise my family to own it. However, I acknowledge that it went up something like 120% this year.

The “set and forget” Vanguard Target Retirement 2055 fund (VFFVX) , currently consisting of roughly 90% diversified stocks and 10% bonds, was up 14.6% in 2023.

Commentary. 2024 again shows that you want to stay in the game. If you waited on the sidelines because stocks have historically high valuations and you were waiting for a dip… well, that didn’t work out. The S&P 500 had two great years in a row, the best two consecutive years in over 25 years according to the WSJ (gift article):

Historically, the S&P 500 annual return is negative in roughly every 1 in 4 years. But holding through that volatility is part of the price you pay for the long-term returns. For most of us, the best we can do is to “stay the course” and enjoy the up years while knowing that the down years will inevitably be sprinkled in there. I try my best not to skip and ignore all the predictions, or even listen to daily market close announcements. If you stand by the roulette table and stare long enough at the red and black numbers that come up, your mind will start to find patterns where they don’t exist.

Instead, here are your cumulative returns through the end of 2024 if you had been a steady investor in the Vanguard Target Retirement 2055 fund over the past several years, despite the many, many problems of the world:

(These work great inside 401ks and IRAs. I’d avoid buying Target Retirement funds in a taxable account.)

Holding cash would have been a lot less scary, but the returns would have been a lot less impressive. I will post more about my personal portfolio changes and performance shortly.

My Money Blog has partnered with CardRatings and may receive a commission from card issuers. Some or all of the card offers that appear on this site are from advertisers and may impact how and where card products appear on the site. MyMoneyBlog.com does not include all card companies or all available card offers. All opinions expressed are the author’s alone, and has not been provided nor approved by any of the companies mentioned.

MyMoneyBlog.com is also a member of the Amazon Associate Program, and if you click through to Amazon and make a purchase, I may earn a small commission. Thank you for your support.


Halfmore App: Turn Your Kids’ Chores into a Roth IRA

My Money Blog has partnered with CardRatings and may receive a commission from card issuers. Some or all of the card offers that appear on this site are from advertisers and may impact how and where card products appear on the site. MyMoneyBlog.com does not include all card companies or all available card offers. All opinions expressed are the author’s alone.

Roth IRAs are popular and powerful, and while they have an earned income requirement, they don’t have a minimum age requirement. As long as a child has “official” earned income, they can contribute that into a Roth IRA (technically a Custodial Roth IRA as a minor, with full rights when they turn 18).

There have been various tips floating around on how parents can help “support” the creation of earned income for their child. There was even a now-defunct website called 1417power.com that would “hire” your kids to take surveys online (of course, the parent had to “hire” 1417power.com first…).

A new app called Halfmore can now facilitate the creation of a nice paper trail between parents as employers and children as workers. They promise to turn chores into a Roth IRA balance. Based on their screenshots, examples of such chores include floor sweeping, washing the dishes, surface dusting, and plant watering. The screenshots also suggest a pay rate of $15 to $16 an hour.

For chores to be recognized as legitimate sources of income, your kids should be paid for tasks you would typically hire another neighborhood kid or a nanny to do (rather than for regular family chores). They should also be appropriate for your child’s age and abilities. Examples include cleaning the garage, mowing the lawn (without a machine), and babysitting. The work must be real, and the wages should be fair.

From what I can gather through the limited information on their website (I had to register to get more details), this is what they offer:

  • They will help you file for an EIN from the government, so you are registered as an official household employer. This is basically the type of thing you should do if you hired a full-time nanny.
  • Through the app, you can track the completion of chores and manage payroll for your children. For example, the washing of dishes can be marked down as 30 minutes of work.
  • They will prepare work documentation for IRS income tax filing and record-keeping requirements.
  • They will help you navigate Federal and State employment taxes.
  • They will help open a custodial Roth IRA for you at Fidelity or Schwab, and transfer money into that account.

The cost is $15 per month or ($144 per year). Their FAQ says this covers up to three children (another place on the website says up to five children). You could file for an EIN, track chores, and open up a custodial Roth yourself for “free”. You are essentially following the same steps as if you were hiring a full-time nanny as a household worker. But if you make enough money such that you are considering this scheme for your kids, then your hourly rate is probably high enough that the convenience factor makes this a reasonable fee.

If you need more chore ideas, here is the Montessori Chart of Age-Appropriate Chores For Kids that keeps floating around like a meme:

spoiledchores

Looking through my archives, I realized that I have already written about “Roth IRA for Kids” in 2007, 2012, and 2019. My eldest child is in middle school now, and I’m still working on how to best teach them about money. I can see a matching program later on in life when they have a real job from an outside employer. But right now, I don’t pay them anything to do their chores. Chores are not a job, they are a responsibility to their family. They can’t decline their chores by declining the money. Maybe I’ll pay for extra jobs around the house, but I think it’s gonna be a stretch for that to add up to thousands of dollars a year.

If you already plan on gifting your child money anyway, this might be a more efficient method. For me, I already tell them that we spend a lot of money on their education right now, and that is our “gift”. I am already paying plenty for tutoring, swim lessons, tennis lessons, STEM camps, etc. Not to mention who knows how much college will cost! I suppose I just feel like this is too far down the list. Maybe my attitude will change later. Maybe I’ll just let them have the sense of accomplishment from funding their own retirement accounts. 😁

My Money Blog has partnered with CardRatings and may receive a commission from card issuers. Some or all of the card offers that appear on this site are from advertisers and may impact how and where card products appear on the site. MyMoneyBlog.com does not include all card companies or all available card offers. All opinions expressed are the author’s alone, and has not been provided nor approved by any of the companies mentioned.

MyMoneyBlog.com is also a member of the Amazon Associate Program, and if you click through to Amazon and make a purchase, I may earn a small commission. Thank you for your support.


2025 401(k) Contribution Limits Announced; New Super Catch-Up for Ages 60-63

My Money Blog has partnered with CardRatings and may receive a commission from card issuers. Some or all of the card offers that appear on this site are from advertisers and may impact how and where card products appear on the site. MyMoneyBlog.com does not include all card companies or all available card offers. All opinions expressed are the author’s alone.

The IRS officially announced the new 401(k) contribution limits for 2025 (full news release), which also included a new “super catch-up” allowance for people who are ages 60-63 at year-end 2025. Strangely, it goes back down once you are age 64. I hadn’t heard of this before now. As usual, by “401(k)” I mean that it applies to 401(k), 403(b), governmental 457 plans, and the federal government’s Thrift Savings Plan.

The 2025 base 401(k) contribution limit is increased to $23,500, up from $23,000. This WSJ article (paywall) has a handy chart for reference.

The 2025 base IRA contribution limit remains at $7,000 (subject to income limits). Taken together, “maxing out” your IRA and 401(k) now takes more than $30,000 a year even ignoring any catch-ups. That’s a lot, but whatever you can cram in there may get roughly a 30% boost towards your final retirement balance.

My Money Blog has partnered with CardRatings and may receive a commission from card issuers. Some or all of the card offers that appear on this site are from advertisers and may impact how and where card products appear on the site. MyMoneyBlog.com does not include all card companies or all available card offers. All opinions expressed are the author’s alone, and has not been provided nor approved by any of the companies mentioned.

MyMoneyBlog.com is also a member of the Amazon Associate Program, and if you click through to Amazon and make a purchase, I may earn a small commission. Thank you for your support.


Savings I Bonds November 2024: 1.20% Fixed Rate, 1.91% Inflation Rate (3.11% Total for First 6 Months)

My Money Blog has partnered with CardRatings and may receive a commission from card issuers. Some or all of the card offers that appear on this site are from advertisers and may impact how and where card products appear on the site. MyMoneyBlog.com does not include all card companies or all available card offers. All opinions expressed are the author’s alone.

Update: Savings I Bonds bought from November 1, 2024 through April 30, 2025 will have a fixed rate of 1.20%, for a total rate of 3.11% for the first 6 months. As a quick and dirty comparison, the nominal yield on 5-year Treasury bonds is currently 4.15% and the real yield on 5-year TIPS is currently 1.77%.

Every existing I Bond will earn this inflation rate of ~1.91% eventually for 6 months; you will need to add your own fixed rate that was set based the initial purchase month. See you again in mid-April for the next early prediction for May 2025.

Original post:

Savings I Bonds are a unique, low-risk investment backed by the US Treasury that pay out a variable interest rate linked to inflation. With a holding period from 12 months to 30 years, you could own them as an alternative to bank certificates of deposit (they are liquid after 12 months) or bonds in your portfolio.

New inflation numbers were just announced at BLS.gov, which allows us to make an early prediction of the November 2024 savings bond rates a couple of weeks before the official announcement on the 1st. This also allows the opportunity to know exactly what an October 2024 savings bond purchase will yield over the next 12 months, instead of just 6 months. You can then compare this against a November 2024 purchase.

New inflation rate prediction. March 2024 CPI-U was 312.332. September 2024 CPI-U was 315.301, for a semi-annual inflation rate of 0.95%. Using the official composite rate formula:

Composite rate formula: [Fixed rate + (2 x semiannual inflation rate) + (fixed rate x semiannual inflation rate)]

This results in the variable component of interest rate for the next 6 month cycle being ~1.90% to 1.91%, depending on the fixed rate.

Tips on purchase and redemption. You can’t redeem until after 12 months of ownership, and any redemptions within 5 years incur an interest penalty of the last 3 months of interest. A simple “trick” with I-Bonds is that if you buy at the end of the month, you’ll still get all the interest for the entire month – same as if you bought it in the beginning of the month. It’s best to give yourself a few business days of buffer time. If you miss the cutoff, your effective purchase date will be bumped into the next month. (You should always sell at the very beginning of the month.)

Buying in October 2024. If you buy before the end of October, the fixed rate portion of I-Bonds will be 1.30%. You will be guaranteed a total interest rate of 1.30 + 2.98 = 4.28% for the next 6 months. For the 6 months after that, the total rate will be 1.30 + 1.91 = 3.21%.

Buying in November 2024. If you buy in November 2024, you will get ~1.91% plus a newly-set fixed rate for the first 6 months. The new fixed rate is officially unknown, but is loosely linked to the real yield of short-term TIPS with some reductions. My rough guess is somewhere between 0.9% and 1.2%. The current real yield on short-term TIPS is lower than it was during the last reset, when the fixed rate was set at 1.3%. Every six months after your purchase, your rate will adjust to your fixed rate (set at purchase) plus a variable rate based on inflation.

If you have an existing I-Bond, the rates reset every 6 months depending on your specific purchase month. Everyone will eventually get this variable rate. Your bond rate = your specific fixed rate (based on purchase month, look it up here) + variable rate (total bond rate has a minimum floor of 0%).

Buy now or wait? Between those two options, I would buy in October as you’ll likely get a higher fixed rate and a decent initial 6-month rate. However, I actually don’t plan to buy any savings bonds this year. The yields are simply not very interesting as compared to other options. Short-term, it’s better to go T-Bills with the state tax exemption. For my inflation-protected needs, I have been buying longer-term TIPS instead to lock in the higher current 2%+ real yields (in tax-deferred).

Unique features and considerations. I have a separate post on reasons to own Series I Savings Bonds, including inflation protection, tax deferral, exemption from state income taxes, and potential tax benefits if used toward qualified educational expenses.

The main drawback is hassle. You can only buy new savings bonds through TreasuryDirect.gov, which is limited in its customer service resources and features. Conducting certain transactions may require a medallion signature guarantee which requires a visit to a physical bank or credit union and snail mail. If your password is compromised, they will not replace any lost or stolen savings bonds. The juice may not be worth the squeeze when you can own individual Treasury bonds or TIPS within any full-service brokerage account. (Finding a bank that will redeem a physical paper savings bond at all can be difficult these days.)

Over the years, I have accumulated I-Bonds and consider it part of the inflation-linked bond allocation inside my long-term investment portfolio. However, after converting all my paper bonds to electronic versions earlier this year, I have been selling the lower fixed rate bonds and reinvesting in 2%+ real yield TIPS.

Annual purchase limits. The annual purchase limit is now $10,000 in online I-bonds per Social Security Number. For a couple, that’s $20,000 per year. As of 2024. you can only buy online at TreasuryDirect.gov, after making sure you’re okay with their security protocols and user-friendliness. (No more tax refund savings bonds.) Technically, the purchase limits are per Social Security Number or Employer Identification Number. For those looking for another way to expand their purchasing power, that means you can also buy for a child, grandchild, LLC, or a trust.

Bottom line. Savings I bonds are a unique, low-risk investment that are linked to inflation and only available to individual investors. You can now only purchase them online at TreasuryDirect.gov. For more background, see the rest of my posts on savings bonds.

[Image: 1942 US Savings Bond poster – source]

My Money Blog has partnered with CardRatings and may receive a commission from card issuers. Some or all of the card offers that appear on this site are from advertisers and may impact how and where card products appear on the site. MyMoneyBlog.com does not include all card companies or all available card offers. All opinions expressed are the author’s alone, and has not been provided nor approved by any of the companies mentioned.

MyMoneyBlog.com is also a member of the Amazon Associate Program, and if you click through to Amazon and make a purchase, I may earn a small commission. Thank you for your support.


Acorns Early 1% Match on Kid Custodial Accounts / Acorns Later 3% Match on IRA Contributions

My Money Blog has partnered with CardRatings and may receive a commission from card issuers. Some or all of the card offers that appear on this site are from advertisers and may impact how and where card products appear on the site. MyMoneyBlog.com does not include all card companies or all available card offers. All opinions expressed are the author’s alone.

Acorns, known for their “Round-Ups” on purchases that encourage recurring small savings of spare change and beyond, also has a match program for IRA contributions. They also just added a new match program for UTMA/UGMA custodial accounts for kids.

Acorns Early is their UTMA/UGMA custodial account for minors, and they will give a 1% match on contributions for Acorns Gold subscribers. These UTMA/UGMA custodial accounts have a few different wrinkles. They are a flexible brokerage account, not like 529 plans where you have to pick from a menu. They can be spent more flexibly as well, not just for qualified educational expenses. A certain amount of income is tax-free each year. However, money in a custodial account is the property of the minor and they assume full control of the account when they become of age.

For 2024, the gift tax exclusion if $18,000 per person ($36,000 from a couple), so the 1% match could be worth up to $180/$360 per kid per year (you can give more, but this is without potentially triggering a gift tax). Friends and family are allowed to contribute as well.

Acorns Later is their IRA account, and they give a 3% match on contributions for Acorns Gold subscribers. Per the 2024 contribution limits, $7,000 x 3% = $210 and $8,000 x 3% = $240 (Age 50+). There is a 4-year hold period.

Acorns Gold costs $12 a month (first month free) and is their highest premium tier with other various perks. So you’d have to balance it all out for your situation.

My Money Blog has partnered with CardRatings and may receive a commission from card issuers. Some or all of the card offers that appear on this site are from advertisers and may impact how and where card products appear on the site. MyMoneyBlog.com does not include all card companies or all available card offers. All opinions expressed are the author’s alone, and has not been provided nor approved by any of the companies mentioned.

MyMoneyBlog.com is also a member of the Amazon Associate Program, and if you click through to Amazon and make a purchase, I may earn a small commission. Thank you for your support.


IRA and 401k Accounts Can Earn You 30% More After 40 Years

My Money Blog has partnered with CardRatings and may receive a commission from card issuers. Some or all of the card offers that appear on this site are from advertisers and may impact how and where card products appear on the site. MyMoneyBlog.com does not include all card companies or all available card offers. All opinions expressed are the author’s alone.

We’re all told that we should use IRA and 401k accounts to save for retirement due to their great tax benefits. But how valuable exactly are those benefits? 🤔 A huge difference? A little difference? This Morningstar article crunches some numbers for “traditional” pre-tax IRA/401ks within a broadly-representative tax situation and three example portfolios. (Although the benefits should be basically the same for Roth accounts, as they end up assuming the same tax rate during the working and retirement years.)

A one-time $5,000 contribution (pre-tax) is invested for 40 years within both the tax-deferred IRA/401k and a taxable brokerage account. The three example portfolios are “100% zero-dividend stocks”, “100% stock index”, and “60% stocks/40% bonds balanced” – essentially most to least tax-efficient. All are assumed to return 8% annually. Here are the results:

Here is the conclusion, quoted directly from the article:

To address this article’s original question, for investments made over a full working career, from age 25 to 65, IRA/401(k) accounts improve the final aftertax value of the study’s assets by 17% for a no-dividend portfolio, 30% for a stock market index fund, and 44% for a low-turnover balanced fund. Those figures, of course, will vary according to personal circumstances, but I conducted enough offscreen spreadsheet tests, using different tax brackets, to conclude that they are broadly representative.

As you might expect, the advantage is greater when the portfolio is less tax-efficient. The more something spins off dividends, capital gains, or interest, the more it should try to go in the tax-deferred bucket.

If you assume the use of the most popular target date retirement funds, they are 90% to 100% stock market index for the majority of the working years (25-65). So there you have it. A 30% boost is a reasonable estimate for most people to carry around in their heads. Roughly 1/3rd more. That’s a lot!

In short, IRA/401(k) plans are a very good deal. And should the latter offer a company match, they become a truly great deal.

My Money Blog has partnered with CardRatings and may receive a commission from card issuers. Some or all of the card offers that appear on this site are from advertisers and may impact how and where card products appear on the site. MyMoneyBlog.com does not include all card companies or all available card offers. All opinions expressed are the author’s alone, and has not been provided nor approved by any of the companies mentioned.

MyMoneyBlog.com is also a member of the Amazon Associate Program, and if you click through to Amazon and make a purchase, I may earn a small commission. Thank you for your support.