MMB Humble Portfolio 2022 1st Quarter Update: Asset Allocation & Performance

My Money Blog has partnered with CardRatings and may receive a commission from card issuers. Some or all of the card offers that appear on this site are from advertisers and may impact how and where card products appear on the site. MyMoneyBlog.com does not include all card companies or all available card offers. All opinions expressed are the author’s alone.

portpie_blank200Here’s my quarterly update on my current investment holdings as of 4/8/22, including our 401k/403b/IRAs and taxable brokerage accounts but excluding a side portfolio of self-directed investments. Following the concept of skin in the game, the following is not a recommendation, but just to share an real, imperfect, low-cost, diversified DIY portfolio. The goal of this “Humble Portfolio” is to create sustainable income that keeps up with inflation to cover our household expenses.

TL;DR changes: Both stocks and bonds went down a small bit. Slightly overweight REITs, slightly underweight International Stocks. As usual, collected dividends and interest and reinvested available leftover cash.

Actual Asset Allocation and Holdings
I use both Personal Capital and a custom Google Spreadsheet to track my investment holdings. The Personal Capital financial tracking app (free, my review) automatically logs into my different accounts, adds up my various balances, tracks my performance, and calculates my overall asset allocation. Once a quarter, I also update my manual Google Spreadsheet (free, instructions) because it helps me calculate how much I need in each asset class to rebalance back towards my target asset allocation. I also create a new tab each quarter, so I have snapshot of my holdings dating back many years.

Here are updated performance and asset allocation charts, per the “Allocation” and “Holdings” tabs of my Personal Capital account.

Stock Holdings (same as last quarter)
Vanguard Total Stock Market (VTI, VTSAX)
Vanguard Total International Stock Market (VXUS, VTIAX)
Vanguard Small Value (VBR)
Vanguard Emerging Markets (VWO)
Avantis International Small Cap Value ETF (AVDV)
Cambria Emerging Shareholder Yield ETF (EYLD)
Vanguard REIT Index (VNQ, VGSLX)

Bond Holdings
Vanguard Limited-Term Tax-Exempt (VMLTX, VMLUX)
Vanguard Intermediate-Term Tax-Exempt (VWITX, VWIUX)
Vanguard Intermediate-Term Treasury (VFITX, VFIUX)
Vanguard Inflation-Protected Securities (VIPSX, VAIPX)
Fidelity Inflation-Protected Bond Index (FIPDX)
iShares Barclays TIPS Bond (TIP)
Individual TIPS bonds
U.S. Savings Bonds (Series I)

Target Asset Allocation. This “Humble Portfolio” does not rely on my ability to pick specific stocks, sectors, trends, or countries. I own broad, low-cost exposure to asset classes that will provide long-term returns above inflation, distribute income via dividends and interest, and finally offer some historical tendencies to balance each other out. I have faith in the long-term benefit of owning publicly-traded US and international shares of businesses, as well as high-quality US Treasury and municipal debt. My stock holdings roughly follow the total world market cap breakdown at roughly 60% US and 40% ex-US. Some minor wrinkles are the inclusion of “small value” ETFs for US, Developed International, and Emerging Markets stocks as well as additional real estate exposure through US REITs.

I strongly believe in the importance of knowing WHY you own something. Every asset class will eventually have a low period, and you must have strong faith during these periods to truly make your money. You have to keep owning and buying more stocks through the stock market crashes. You have to maintain and even buy more rental properties during a housing crunch, etc. A good sign is that if prices drop, you’ll want to buy more of that asset instead of less. I don’t have strong faith in the long-term results of commodities, gold, or bitcoin – so I don’t own them. Simple as that.

I do not spend a lot of time backtesting various model portfolios, as I don’t think picking through the details of the recent past will necessarily create superior future returns. Usually, whatever model portfolio is popular in the moment just happens to hold the asset class that has been the hottest recently as well.

Find productive assets that you believe in and understand, and just keep buying them through the ups and downs. Mine may be different than yours.

Stocks Breakdown

  • 45% US Total Market
  • 7% US Small-Cap Value
  • 31% International Total Market
  • 7% International Small-Cap Value
  • 10% US Real Estate (REIT)

Bonds Breakdown

  • 66% High-Quality bonds, Municipal, US Treasury or FDIC-insured deposits
  • 34% US Treasury Inflation-Protected Bonds (or I Savings Bonds)

I have settled into a long-term target ratio of 67% stocks and 33% bonds (2:1 ratio) within our investment strategy of buy, hold, and occasionally rebalance. This is more conservative than most people my age, but I am settling into a more “perpetual income portfolio” as opposed to the more common “build up a big stash and hope it lasts until I die” portfolio. My target withdrawal rate is 3% or less. With a self-managed, simple portfolio of low-cost funds, we can minimize management fees, commissions, and taxes.

Holdings commentary. I know I sound like a broken record, but really, my best investment decisions have been convincing myself to do nothing during times of stress. Sometimes it was easy, sometimes it was hard. Still, after investing steadily for over 15 years, my results have exceeded my expectations and the fluctuations are now often greater than my annual spending. To make it easier, I try to ignore daily talk about stock movements.

There is ALWAYS something that looks worrying. I am a “buy, hold, and cash the checks” kind of investor. I often wonder how I can teach my children such patience in investing, and that seems to be the hardest aspect.

Performance numbers. According to Personal Capital, my portfolio down about 6% for 2022 YTD. US stocks, International stocks, and even US bonds are all down roughly 6-8%. REITs are the only things that went up. As such, in terms of rebalancing, the portfolio is slightly overweight in REITs and slightly underweight in International Stocks, so that is where the excess cash will be invested this quarter.

I’ll share about more about the income aspect in a separate post.

My Money Blog has partnered with CardRatings and may receive a commission from card issuers. Some or all of the card offers that appear on this site are from advertisers and may impact how and where card products appear on the site. MyMoneyBlog.com does not include all card companies or all available card offers. All opinions expressed are the author’s alone, and has not been provided nor approved by any of the companies mentioned.

MyMoneyBlog.com is also a member of the Amazon Associate Program, and if you click through to Amazon and make a purchase, I may earn a small commission. Thank you for your support.


Backdoor Roth IRA Contribution 2022: Tips and Vanguard Example Screenshots

My Money Blog has partnered with CardRatings and may receive a commission from card issuers. Some or all of the card offers that appear on this site are from advertisers and may impact how and where card products appear on the site. MyMoneyBlog.com does not include all card companies or all available card offers. All opinions expressed are the author’s alone.

The official IRA contribution deadline for Tax Year 2021 is April 15th, 2022. However, I choose to use April 15th as the informal deadline for my same-year IRA contributions (Tax Year 2022). By around April 1st, I have usually finished filing my income taxes and thus have handled any expected tax bills. I also have the first quarter of dividends arrive in my brokerage accounts, so I also have funds ready to re-invest. The optimal time would actually be make my contributions on January 1st, but sometimes we just have to settle for “good enough”.

If your Modified Adjusted Gross Income (MAGI) exceeds the limits for a direct Roth IRA contribution ($144,000 for singles and $214,000 for married filing joint for tax year 2022), you may still be eligible for the “Backdoor” Roth IRA. Christine Benz of Morningstar has a excellent summary of Backdoor Roth IRA concerns.

A backdoor Roth is simple enough and should be tax-free in many cases. An investor who earns too much to make a direct Roth IRA contribution simply opens a traditional nondeductible IRA–available to investors regardless of income level. Shortly thereafter–and here’s where the backdoor part comes in–he converts it to a Roth IRA, another move unrestricted by income limits. Assuming he has no other IRA assets, the only taxes due on the conversion would be any appreciation in the investments since he opened the account. That taxable amount should be limited, assuming he converts the money promptly and/or leaves the money in cash until the conversion is finalized.

Here’s my even-shorter version of the tips:

  • First, check if you have other pre-tax traditional IRA assets such as a rollover IRA. Converting to a Roth IRA may subject these assets to taxes on a pro-rated basis.
  • Get rid of these pre-tax IRAs, if possible, by rolling them into an employer 401(k), 403(b), or 457 plan instead. Self-employed business owners can also roll into a Solo 401k.
  • Contribute and then convert to Roth quickly. Make the non-deductible Traditional IRA contribution, invest for a day or two in cash, and then quickly convert to Roth. The IRS has clarified that no waiting period is required, making it better to do it right away to avoid any tax complications.
  • Repeat at the beginning of every year. Just keep doing it every year, as soon as you can, and build up that precious Roth IRA balance that can grow tax-free forever with no required minimum distributions. Ignore news about the option “maybe” going away until it actually goes away.

Here’s our simple three-day process at Vanguard.

Day one: Make non-deductible contribution to a Traditional IRA account. You could fund in various ways, I exchanged from funds within my Vanguard taxable brokerage account. Just put it in Vanguard Federal Money Market temporarily.

Day two: Go to “Balances & Holdings” page and find the “Convert to Roth IRA” link. Complete required steps.

Day three: Your traditional IRA balance is now $0. Invest the funds that are now in your Roth IRA. In this case, I would have a taxable gain of just $0.03, which simply rounds to zero.

Note: There is still some debate about how much time should pass between the non-deductible Traditional IRA contribution and the Roth conversion. Some people believe that the 2017 Tax Cuts and Jobs Act (TCJA) officially signaled acceptance of this move. Others still want you to wait either for a monthly statement or even a full year in between the steps. I’m not a tax attorney and this is not tax advice. This is just what I did and I don’t lose any sleep over it.

My Money Blog has partnered with CardRatings and may receive a commission from card issuers. Some or all of the card offers that appear on this site are from advertisers and may impact how and where card products appear on the site. MyMoneyBlog.com does not include all card companies or all available card offers. All opinions expressed are the author’s alone, and has not been provided nor approved by any of the companies mentioned.

MyMoneyBlog.com is also a member of the Amazon Associate Program, and if you click through to Amazon and make a purchase, I may earn a small commission. Thank you for your support.


Optimal Target Date Fund Glide Path, Per Deep Learning AI

My Money Blog has partnered with CardRatings and may receive a commission from card issuers. Some or all of the card offers that appear on this site are from advertisers and may impact how and where card products appear on the site. MyMoneyBlog.com does not include all card companies or all available card offers. All opinions expressed are the author’s alone.

The WSJ article Why Target-Date Funds Might Be Inappropriate for Most Investors (free gift article) discusses new research using “deep learning” artificial intelligence to find the optimal asset allocation over time. There are several interesting insights that also agree with common sense. For example, one size doesn’t fit all. Wealthier investors can withstand the volatility from holding a much higher stock allocation, whereas lower net worth investors need to be more conservative to avoid a hitting zero due to a bad sequence of returns.

Here is how the optimal glide path for the average investor differs between Deep Learning analysis vs. actual Target Date Funds:

Though the primary insight of this modeling is that one size doesn’t fit all, the research did reach one conclusion that does apply to all of us on average: The typical glide path used by target-date funds is too conservative starting at the age of 50. In contrast to an equity exposure level that drops to 50% by retirement age and to as low as 30% during retirement, the average recommended equity exposure in the researchers’ model never falls below 60%.

While I don’t know the details regarding the underlying assumptions of this research, the red AI line caught my eye because I also don’t plan on going below about 60% stocks ever in my lifetime. My reasoning is that I am going for a “perpetual withdrawal rate” scenario where my I just live off a base of growing dividends and interest. (I’m not talking about owning only extreme high-yield products like closed-end ETFs, junk bonds, and leveraged REITs). After reaching the “safe withdrawal rate” number that is based on a very high likelihood of not dying with zero, I wanted even more margin of safety. It can be counterintuitive, but over the long run owning businesses can be “safer” than just own a big bag of cash that is constantly exposed to inflation risk.

My Money Blog has partnered with CardRatings and may receive a commission from card issuers. Some or all of the card offers that appear on this site are from advertisers and may impact how and where card products appear on the site. MyMoneyBlog.com does not include all card companies or all available card offers. All opinions expressed are the author’s alone, and has not been provided nor approved by any of the companies mentioned.

MyMoneyBlog.com is also a member of the Amazon Associate Program, and if you click through to Amazon and make a purchase, I may earn a small commission. Thank you for your support.


Schwab Lifetime Adjustable Income: Flexible Withdrawal Rules Based On Portfolio Survival Chances

My Money Blog has partnered with CardRatings and may receive a commission from card issuers. Some or all of the card offers that appear on this site are from advertisers and may impact how and where card products appear on the site. MyMoneyBlog.com does not include all card companies or all available card offers. All opinions expressed are the author’s alone.

One of the perpetual debates in retirement planning circles is withdrawal rates, AKA how much monthly income can you take from a portfolio. Once you nail down a withdrawal rate and retirement spending target, then you get Your Number – how much you need to have saved to retire (after backing out Social Security and other income streams). It’s common to start with the static 4% rule, but that rule also includes some drawbacks. An alternative is a flexible withdrawal rule that adjusts based on market returns. When your portfolio grows, you can spend a little more. If it shrinks, you cut back a little. Sounds reasonable, right?

However, I haven’t seen many real-world examples of flexible withdrawal rules. Schwab has helpfully outlined one proposed method in this memo: Lifetime Adjustable Income vs. the 4% Rule: Can You Spend More in Retirement with Less Risk? This provides the underlying basis behind their robo-advisor feature called Intelligent Income where you can pick a comfort level and the software will tell you how much you can withdraw each year and from which type of account (IRA, Roth IRA, taxable, etc).

In this memo, we compare a flexible withdrawal strategy to the static 4% rule. We recommend a lifetime adjustable income strategy, described in this paper, that can be put into action using an annually updated financial plan, using technology or an advisor. Doing so may help increase spending early in, and over a long, retirement and help ensure your money lasts.

Here’s their example structure for flexible withdrawals:

  • Set an initial withdrawal rate that delivers an 80% probability of success (savings lasting).
  • Adjust spending amounts after each year based on if the probability of savings lasting falls outside the range you decide: here it is below 75% or above 99%. If these thresholds are crossed, increase or decrease spending by the amount that brings the financial plan back to a 99% probability of savings lasting. This results in fewer but more drastic cuts.
  • Add “guardrails”. A minimum and maximum acceptable annual (real) spending amount of $25,000 and $60,000, respectively, meaning that we will always withdraw at least $25,000 (or at most $60,000).

Using these flexible rules, the initial withdrawal rate was about $43,000 instead of $40,000. Across all of the simulated scenarios, the average annual withdrawal was basically 20%, or $10,000 a year, higher: $50,000 a year instead of the $40,000 a year (in today’s dollars). Even better, the likelihood of running out of money dropped.

However, you must look past the averages and see that you are now exposed to the extremes. Look at that wide expanse of grey. A significant number of the scenarios involved some extended deep cuts to spending, hitting and hovering just above the $25,000 minimum guardrail. You’ll have to decided if you like this trade-off between probably getting more income but possibly enduring some big cuts. This is why many financially-conservative people would prefer to simply start out at a lower 3% or 3.5% withdrawal rate and adjust upwards if the portfolio keeps growing.

In any case, I found it interesting that Schwab used the probability of portfolio survival rate as the factor used to adjust withdrawal rate. DIY investors can implement a similar system themselves. Here are some tools to estimate portfolio survival probability:

My Money Blog has partnered with CardRatings and may receive a commission from card issuers. Some or all of the card offers that appear on this site are from advertisers and may impact how and where card products appear on the site. MyMoneyBlog.com does not include all card companies or all available card offers. All opinions expressed are the author’s alone, and has not been provided nor approved by any of the companies mentioned.

MyMoneyBlog.com is also a member of the Amazon Associate Program, and if you click through to Amazon and make a purchase, I may earn a small commission. Thank you for your support.


Big List of Social Security Tools: Best Time to Start Claiming Social Security Benefits?

My Money Blog has partnered with CardRatings and may receive a commission from card issuers. Some or all of the card offers that appear on this site are from advertisers and may impact how and where card products appear on the site. MyMoneyBlog.com does not include all card companies or all available card offers. All opinions expressed are the author’s alone.

Social Security is the largest source of retirement income for a majority of Americans. For about 1/3rd of them, Social Security makes up 90% or more of their retirement income.

ss_percent

Depending on your assumptions, the “lump sum value” of your Social Security benefits is somewhere between $300,000 and $700,000. (Source: Kitces)

Even this large figure ignores the fact that your Social Security income is guaranteed to rise each year with inflation, something no other private annuity company in the world even offers any longer at any price!

Therefore, spending a little time and money in order to consider the many options for Social Security (especially for those married, divorced, widowed, or disabled) can really make a difference. This NYT article (free, gift article) lists a number of services that help you navigate the rules (at a variety of service levels and price points). In no particular order:

I don’t have any in-depth experience with any of these online tools, but when the time comes I’d probably pony up the money (adds up to less than $100 for all three) and compare the results. If they are properly programmed, they should all agree, right?

The tools below go beyond Social Security claiming strategies and more into overall retirement income planning.

Even if you’re still far away from claiming time, be sure to sign up for your official mySocialSecurity account (before a scammer does) and take a peek at your stats each year. For those that like tinkering, try copy and pasting your anonymous data into the SSA.tools website (free) and play around with different future scenarios.

In the end, you may not follow the software recommendations exactly, but simply knowing about the different options and factors can be helpful. In my experience, many people just end up claiming earlier because they want “their” money sooner rather than later without understanding the potential drawbacks. A retiree may want to have their “own” paycheck again if their partner still works.

My Money Blog has partnered with CardRatings and may receive a commission from card issuers. Some or all of the card offers that appear on this site are from advertisers and may impact how and where card products appear on the site. MyMoneyBlog.com does not include all card companies or all available card offers. All opinions expressed are the author’s alone, and has not been provided nor approved by any of the companies mentioned.

MyMoneyBlog.com is also a member of the Amazon Associate Program, and if you click through to Amazon and make a purchase, I may earn a small commission. Thank you for your support.


Will Your Robo-Advisor Stay The Course? UBS Buys Wealthfront

My Money Blog has partnered with CardRatings and may receive a commission from card issuers. Some or all of the card offers that appear on this site are from advertisers and may impact how and where card products appear on the site. MyMoneyBlog.com does not include all card companies or all available card offers. All opinions expressed are the author’s alone.

Over time, more and more people are seeing the benefits of investing in stocks and bonds through low-cost index funds. Here is a chart from Morningstar showing the overall flow of assets out of actively-managed and into passively-managed US equity funds over the last 15 years.

For a while, people wondered if low-cost digital advisors that managed a portfolio of index funds for a modest fee would take over. The picture looks a little different today.

Wealthfront was one of the early digital-only startups, promising to manage a diversified portfolio of low-cost ETFs for you for a modest 0.25% of assets, even if you had as little as $500 to invest. They tried a few different things over the years, including changing up their model portfolios, trying to add a in-house risk-parity fund, and even recently adding crypto and individual stock options. Their final move came this week, when they announced they would be sold to UBS for $1.4 billion. This wasn’t exactly a huge exit, given the huge amount of venture capital they had burned through over the years. As usual with such acquisitions, they promise both “nothing will change” and “things will only get better”.

In hindsight, I am relieved that I didn’t let Wealthfront handle my assets. They clearly had no firm guiding principles, tweaking their portfolios with each new trend. Based on the reporting, it looks like they sold their customers to the highest bidder, as UBS is not exactly known for low-cost passive investing. This play is widely seen a way for UBS to obtain young investors that will one day be rich (read: one day will generate lots of wealth management fees). See UBS Buys Wealthfront for $1.4 Billion to Reach Rich Young Americans and Why a Bank for the Super Rich Is Taking Aim at the Younger Merely Rich.

Is this move what is best for Wealthfront’s customers? Or what was best for Wealthfront’s investors? Mark the date. I will be checking to see what Wealthfront clients own in 5 and 10 years, if that is still possible. Keep in mind that any portfolio changes usually result in taxable events.

Funds flowed into index funds for a simple reason: they performed better and made folks more money. Index funds performed better primarily due to low costs and low turnover (low tax costs). However, it doesn’t appear that Wealthfront could operate successfully independently while offering low costs. One way or another, the new owners are going to try and extract more money per client either via portfolio changes or higher fee products.

Unfortunately, I worry that even Vanguard, in its pursuit of growth, is gradually going down the same path as many large nonprofits. Many “nonprofits” are huge bureaucracies that chase money as eagerly as any corporation – more money means bigger salaries to management, more political power, and greater career advancement. (Side note: I thought that Vanguard got away with their huge Target Date fund capital gains distribution with little media attention, but now see: Massachusetts investigating sales of target date funds to retail investors after word of surprise tax bills.)

I don’t write much about robo-advisors any more. They showed promise initially, but apparently the business model just isn’t working.

My Money Blog has partnered with CardRatings and may receive a commission from card issuers. Some or all of the card offers that appear on this site are from advertisers and may impact how and where card products appear on the site. MyMoneyBlog.com does not include all card companies or all available card offers. All opinions expressed are the author’s alone, and has not been provided nor approved by any of the companies mentioned.

MyMoneyBlog.com is also a member of the Amazon Associate Program, and if you click through to Amazon and make a purchase, I may earn a small commission. Thank you for your support.


MMB Portfolio 2021 Year-End (Late Update): Dividend and Interest Income

My Money Blog has partnered with CardRatings and may receive a commission from card issuers. Some or all of the card offers that appear on this site are from advertisers and may impact how and where card products appear on the site. MyMoneyBlog.com does not include all card companies or all available card offers. All opinions expressed are the author’s alone.

dividendmono225
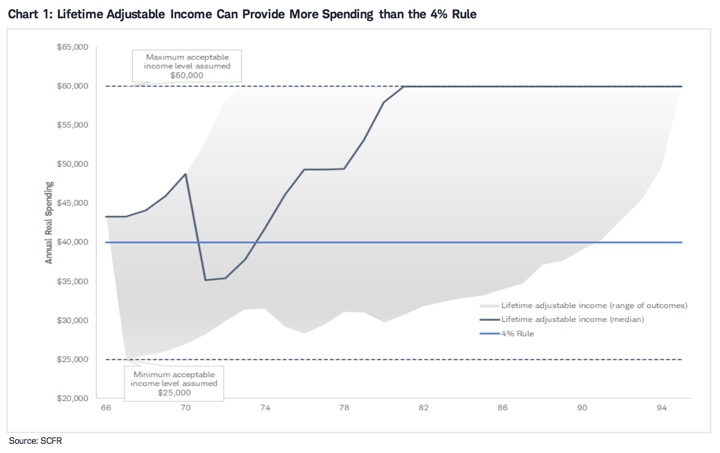
Here’s my (late) quarterly update on the income produced by my “Humble Portfolio“. The total income goes up much more gradually and consistently than the number shown on brokerage statements (price), encouraging me as I keep plowing more of my savings into more stock purchases. I imagine them as a factory that just churns out more dollar bills.

via GIPHY

Income yield history (percentage of portfolio value). Here is a chart showing how this 12-month trailing income rate has varied since I started tracking it in 2014. There appears to be a slight recovery from the early pandemic time period.

I track the “TTM” or “12-Month Yield” from Morningstar, which is the sum of the trailing 12 months of interest and dividend payments divided by the last month’s ending share price (NAV) plus any capital gains distributed over the same period. (ETFs rarely have to distribute capital gains.) I prefer this measure because it is based on historical distributions and not a forecast. Below is a rough approximation of my portfolio (2/3rd stocks and 1/3rd bonds).

Asset Class / Fund % of Portfolio Trailing 12-Month Yield (Taken 1/24/22) Yield Contribution
US Total Stock
Vanguard Total Stock Market Fund (VTI, VTSAX)
25% 1.21% 0.30%
US Small Value
Vanguard Small-Cap Value ETF (VBR)
5% 1.75% 0.09%
International Total Stock
Vanguard Total International Stock Market Fund (VXUS, VTIAX)
25% 3.09% 0.77%
Emerging Markets
Vanguard Emerging Markets ETF (VWO)
5% 2.64% 0.13%
US Real Estate
Vanguard REIT Index Fund (VNQ, VGSLX)
6% 2.56% 0.15%
Intermediate-Term High Quality Bonds
Vanguard Intermediate-Term Treasury ETF (VGIT)
17% 1.14% 0.19%
Inflation-Linked Treasury Bonds
Vanguard Short-Term Inflation-Protected Securities ETF (VTIP)
17% 4.69% 0.80%
Totals 100% 2.44%


Stock dividends are the portion of profits that businesses have decided they don’t need to reinvest into their business. The dividends may suffer some short-term drops, but over the long run they have grown faster than inflation.

The ratio of dividend payouts to price also serve as a rough valuation metric. When stock prices drop, this percentage metric usually goes up – which makes me feel better in a bear market. When stock prices go up, this percentage metric usually goes down, which keeps me from getting too euphoric during a bull market.

Here’s a related quote from Jack Bogle (source):

The true investor will do better if he forgets about the stock market and pays attention to his dividend returns and to the operating results of his companies.

Absolute dividend history. Even though the dividend yield hasn’t been too impressive, there is a different story when you look at the absolute amount of income paid out over time. If you retired back in 2014 and have been living off your stock/bond portfolio, your total income distributions are much higher in 2022 than in 2014.

Here is the historical growth of the S&P 500 absolute dividend, which tracks roughly the largest 500 stocks in the US, updated as of Q4 2021 (via Yardeni Research):

This means that if you owned enough of the S&P 500 to produce an annual dividend income of about $13,000 a year in 1999, then today those same shares would be worth a lot more AND your annual dividend income would have increased to over $50,000 a year, even if you had spent every penny of dividend income every year.

Here is the historical growth of the absolute dividend of the EAFE iShares MSCI ETF, which tracks a broad index of developed non-US stocks (VXUS is a newer ETF), via Netcials.

European dividend culture seems to encourage paying out a higher percentage of earnings as dividends, but as a result those dividends are also more volatile, moving up and down with earnings. US dividend culture tends to be more conservative, with the expectation that dividends will be growing or at least stable. This is not true across every company, but in general there appears to be a greater stigma associated with dividend cuts in US stocks than in international stocks.

Big picture and rules of thumb. If you are not close to retirement, there is not much use worrying about decimal points. Your time is better spent focusing on earning potential via better career moves, improving in your skillset, and/or looking for entrepreneurial opportunities where you can have an ownership interest.

As a result, I support the simple 4% or 3% rule of thumb, which equates to a target of accumulating roughly 25 to 30 times your annual expenses. I would lean towards a 3% withdrawal rate if you want to retire young (before age 50) and a 4% withdrawal rate if retiring at a more traditional age (closer to 65). Build in some spending flexibility to make your portfolio more resilient in the real world, and that’s a reasonable goal to put on your wall.

Using the income before “full” retirement. Our dividends and interest income are not automatically reinvested. I treat this money as part of our “paycheck”. Then, as with a traditional paycheck, we can choose to either spend it or invest it again to compound things more quickly. Even if still working, you could use this money to cut back working hours, pursue a different career path, start a new business, take a sabbatical, perform charity or volunteer work, and so on. This is your one life and it only lasts about 4,000 weeks.

My Money Blog has partnered with CardRatings and may receive a commission from card issuers. Some or all of the card offers that appear on this site are from advertisers and may impact how and where card products appear on the site. MyMoneyBlog.com does not include all card companies or all available card offers. All opinions expressed are the author’s alone, and has not been provided nor approved by any of the companies mentioned.

MyMoneyBlog.com is also a member of the Amazon Associate Program, and if you click through to Amazon and make a purchase, I may earn a small commission. Thank you for your support.


MMB Portfolio 2021 Year-End (Late Update): Asset Allocation & Performance

My Money Blog has partnered with CardRatings and may receive a commission from card issuers. Some or all of the card offers that appear on this site are from advertisers and may impact how and where card products appear on the site. MyMoneyBlog.com does not include all card companies or all available card offers. All opinions expressed are the author’s alone.

portpie_blank200Here’s my (late) quarterly update on my current investment holdings, as of 1/23/22, including our 401k/403b/IRAs and taxable brokerage accounts but excluding a side portfolio of self-directed investments. Following the concept of skin in the game, the following is not a recommendation, but just to share an real, imperfect, low-cost, diversified DIY portfolio. The goal of this portfolio is to create sustainable income that keeps up with inflation to cover our household expenses.

Actual Asset Allocation and Holdings
I use both Personal Capital and a custom Google Spreadsheet to track my investment holdings. The Personal Capital financial tracking app (free, my review) automatically logs into my different accounts, adds up my various balances, tracks my performance, and calculates my overall asset allocation. Once a quarter, I also update my manual Google Spreadsheet (free, instructions) because it helps me calculate how much I need in each asset class to rebalance back towards my target asset allocation.

Here are updated performance and asset allocation charts, per the “Allocation” and “Holdings” tabs of my Personal Capital account.

Stock Holdings
Vanguard Total Stock Market (VTI, VTSAX)
Vanguard Total International Stock Market (VXUS, VTIAX)
Vanguard Small Value (VBR)
Vanguard Emerging Markets (VWO)
Avantis International Small Cap Value ETF (AVDV)
Cambria Emerging Shareholder Yield ETF (EYLD)
Vanguard REIT Index (VNQ, VGSLX)

Bond Holdings
Vanguard Limited-Term Tax-Exempt (VMLTX, VMLUX)
Vanguard Intermediate-Term Tax-Exempt (VWITX, VWIUX)
Vanguard Intermediate-Term Treasury (VFITX, VFIUX)
Vanguard Inflation-Protected Securities (VIPSX, VAIPX)
Fidelity Inflation-Protected Bond Index (FIPDX)
iShares Barclays TIPS Bond (TIP)
Individual TIPS bonds
U.S. Savings Bonds (Series I)

Target Asset Allocation. This “Humble Portfolio” does not rely on my ability to pick specific stocks, sectors, trends, or countries. I own broad, low-cost exposure to asset classes that will provide long-term returns above inflation, distribute income via dividends and interest, and finally offer some historical tendencies to balance each other out. I have faith in the long-term benefit of owning publicly-traded US and international shares of businesses, as well as high-quality US federal and municipal debt. My stock holdings roughly follow the total world market cap breakdown at roughly 60% US and 40% ex-US. I also own real estate through REITs.

I strongly believe in the importance of “knowing WHY you own something”. Every asset class will eventually have a low period, and you must have strong faith during these periods to truly make your money. You have to keep owning and buying more stocks through the stock market crashes. You have to maintain and even buy more rental properties during a housing crunch, etc. You might own laundromats or vending machines or an online business. A good sign is that if prices drop, you’ll want to buy more of that asset instead of less.

Find a good asset that you believe in and understand, and just keep buying it through the ups and downs.

I do not spend a lot of time backtesting various model portfolios, as I don’t think picking through the details of the recent past will necessarily create superior future returns. Usually, whatever model portfolio is popular in the moment just happens to hold the asset class that has been the hottest recently as well. I’ve also realized that I don’t have strong faith in the long-term results of commodities, gold, or bitcoin. I’ve tried many times to wrap my head around it, but have failed. I prefer things that send me checks while I sleep.

Stocks Breakdown

  • 45% US Total Market
  • 7% US Small-Cap Value
  • 31% International Total Market
  • 7% International Small-Cap Value
  • 10% US Real Estate (REIT)

Bonds Breakdown

  • 66% High-Quality bonds, Municipal, US Treasury or FDIC-insured deposits
  • 33% US Treasury Inflation-Protected Bonds (or I Savings Bonds)

I have settled into a long-term target ratio of 67% stocks and 33% bonds (2:1 ratio) within our investment strategy of buy, hold, and occasionally rebalance. This is more conservative than most people my age, but I am settling into a more “perpetual” as opposed to the more common “build up a big stash and hope it lasts until I die” portfolio. My target withdrawal rate is 3% or less. With a self-managed, simple portfolio of low-cost funds, we can minimize management fees, commissions, and taxes.

Holdings commentary. I’ve been investing steadily for over 15 years, and the results have exceeded my expectations. There is ALWAYS something that looks worrying. Looking back, my best investment decisions were to NOT do anything different during times of stress. Maybe 2022 will have more such times. Ignore the noise, if you can.

I often wonder how I can teach my children such patience in investing, and that seems to be the hardest aspect.

Performance numbers. According to Personal Capital, my portfolio is up another +13.9% for 2021.

I’ll share about more about the income aspect in a separate post.

My Money Blog has partnered with CardRatings and may receive a commission from card issuers. Some or all of the card offers that appear on this site are from advertisers and may impact how and where card products appear on the site. MyMoneyBlog.com does not include all card companies or all available card offers. All opinions expressed are the author’s alone, and has not been provided nor approved by any of the companies mentioned.

MyMoneyBlog.com is also a member of the Amazon Associate Program, and if you click through to Amazon and make a purchase, I may earn a small commission. Thank you for your support.


Real-World Numbers: Investing $850 a Month Turned Into $200,000 Over 10 Years (2022 Edition)

My Money Blog has partnered with CardRatings and may receive a commission from card issuers. Some or all of the card offers that appear on this site are from advertisers and may impact how and where card products appear on the site. MyMoneyBlog.com does not include all card companies or all available card offers. All opinions expressed are the author’s alone.

Instead of focusing on the current hot thing, how about stepping back and taking the longer view? How would a steady investor have done over the last decade? Most successful savers invest money each year over a long period of time.

Target date funds. The Vanguard Target Retirement 2045 Fund is an all-in-one fund that is low-cost, globally-diversified, and available both inside many employer retirement plans and to anyone that funds an IRA. When you are young (up until age 40 for those retiring at 65), this fund holds 90% stocks and 10% bonds. It is a solid default choice in a world of mediocre, overpriced options. This is also a good benchmark for others that use low-cost index funds.

The power of consistent, tax-advantaged investing. For the last decade, the maximum allowable annual contribution to a Traditional or Roth IRA has been roughly $5,000 per person. The maximum allowable annual contribution for a 401k, 403b, or TSP plan has been over $10,000 per person. If you have a household income of $67,000, then $10,000 is right at the 15% savings rate mark. Therefore, I’m going to use $10,000 as a benchmark amount. This round number also makes it easy to multiply the results as needed to match your own situation. Save $5,000 a year? Halve the result. Save $20,000 a year? Double the numbers, and so on.

The real-world payoff from a decade of saving $833 a month. What would have happened if you put $10,000 a year into the Vanguard Target Retirement 2045 Fund, every year, for the past 10 years? With the interactive tools at Morningstar and a Google spreadsheet, we get this:

Investing $10,000 every year ($833 a month, or $384 per bi-weekly paycheck) for the last decade would have resulted in a total balance of $196,000. Bump that up to $850 a month, and you’d be sitting on $200,000 right now, broken up into $102,000 in contribution and $98,000 in investment gains.

What would have happened if you extended that to the past 15 years instead? Investing $10,000 every year for the last decade and a half would have resulted in a total balance of $353,000. That breaks down to $150k in contributions + $203k investment growth. Your gains are now officially more than what you initially invested.

Real-world path to becoming a 401(k) millionaire. Not theoretical numbers from a calculator! Are you a dual-income household that can put away more? If you each invested $14,150 a year ($28,300 total for both) for the last 15 years, you would have a million dollars. That means starting at age 22 and ending at 37, or starting at 25 and ending at 40.

It gets even better if you started early. There is a popular example of the power of compound interest that shows how someone who started saving at age 25, saves and invests for 10 years but then stops and never saves a penny again still beats someone who starts saving at 35 and keeps on saving for 30 years. Acorns provides a nice illustration:

Once you have that initial momentum, it just keeps going.

Timing still matters, but not as much as you might think due to the dollar-cost averaging and longer time horizon. Yes, the last decade has been a great run for US stock markets. But Vanguard Target funds also own a lot of international stocks, which haven’t been nearly as hot and have maintained lower valuations. Diversification means you aren’t 100% in the hot thing, but your bases are covered if the hot things goes cold. Here are my previous “saving for a decade” posts:

Work on improving your career skills (or start your own business), save a big chunk of your income, and then invest it in productive assets. Keep calm and repeat. The only “secret” here is consistency and starting as early as you can. (The best time is always yesterday. The second best time is today.) We have maxed out both IRA and the 401k salary deferral limits nearly every year since 2004. We are fortunate in many ways, but we received no inheritance and no house downpayment assistance. We are not super-skilled stock pickers or Bitcoin early adopters. You can still build serious wealth with something as accessible and boring as the Vanguard Target Retirement fund (or a simple collection of low-cost index funds).

My Money Blog has partnered with CardRatings and may receive a commission from card issuers. Some or all of the card offers that appear on this site are from advertisers and may impact how and where card products appear on the site. MyMoneyBlog.com does not include all card companies or all available card offers. All opinions expressed are the author’s alone, and has not been provided nor approved by any of the companies mentioned.

MyMoneyBlog.com is also a member of the Amazon Associate Program, and if you click through to Amazon and make a purchase, I may earn a small commission. Thank you for your support.


2022 401k and IRA Contribution Limits

My Money Blog has partnered with CardRatings and may receive a commission from card issuers. Some or all of the card offers that appear on this site are from advertisers and may impact how and where card products appear on the site. MyMoneyBlog.com does not include all card companies or all available card offers. All opinions expressed are the author’s alone.

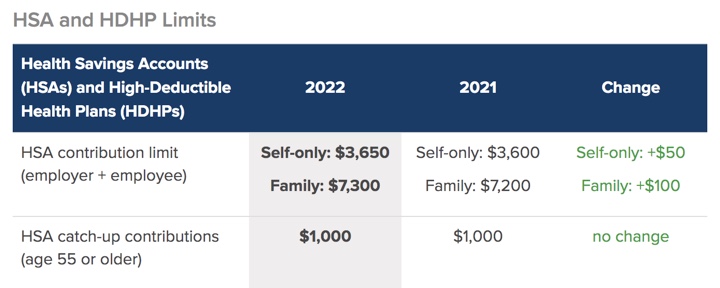
The beginning of the year is a good time to check on the new annual contribution limits to the various available retirement accounts. Our income has been quite variable these last few years, so I regularly adjust the paycheck deferral percentages based on expected income for the year. This SHRM article has a nice summary of 2022 vs. 2021 numbers for most employer-based accounts.

401k/403b Employer-Sponsored Accounts.

For example, I would break down the applicable limit down to monthly and bi-weekly amounts:

  • $20,500 annual limit = $1,708 per monthly paycheck.
  • $20,500 annual limit = $788 per bi-weekly paycheck.

If you are contributing to a pre-tax account instead of a Roth, you could also use a paycheck calculator to find the detailed impact to your take-home pay.

The higher numbers are for those folks that have the ability to contribute extra money into their 401k accounts on an after-tax basis (and potentially perform an in-service Roth rollover), or those self-employed persons with SEP IRAs or Self-Employed 401k plans.

The investment options in 401k plans have also improved on average steadily over the years with lower fees and costs, allowing your money to compound even faster.

Traditional/Roth IRAs. The annual contribution limits is unchanged from last year, $6,000 with an additional $1,000 allowed for those age 50+.

  • $6,000 annual limit = $500 per monthly paycheck.
  • $6,000 annual limit = $231 per bi-weekly paycheck.

Most brokerage accounts (Vanguard, Fidelity, M1 Finance) will allow you to set up automatic investments on a weekly, biweekly, or monthly basis. As long as you have enough money in your linked checking account, the broker will transfer the cash over and then invest it on a recurring basis. You may even be able to sync it to take out money the very same or next day as when your paycheck hits.

Health Savings Accounts are often treated as the equivalent of a “Healthcare IRA” due the potential triple tax benefits (tax-deduction on contributions, tax-deferred growth for decades, and tax-free withdrawals towards qualified healthcare expenses). This assumes that you have a high-deductible health insurance plan, you can cover your current healthcare expenses out-of-pocket, you can still afford to contribute to the HSA.

Even though I’ve been parroting the “standard personal finance advice” to raise that contribution percentage and save as much as you can in your 401k for years and years, it still holds true. There is some true mind trickery when the money never touches your bank account. The easiest way for me not to eat potato chips is not the have them in the house. (My nemesis is that Costco mega-sized bag of Himalayan Salt Kettle Chips…) The easiest way to make sure you don’t spend the money that you want to invest, is to never have it touch your bank account.

My Money Blog has partnered with CardRatings and may receive a commission from card issuers. Some or all of the card offers that appear on this site are from advertisers and may impact how and where card products appear on the site. MyMoneyBlog.com does not include all card companies or all available card offers. All opinions expressed are the author’s alone, and has not been provided nor approved by any of the companies mentioned.

MyMoneyBlog.com is also a member of the Amazon Associate Program, and if you click through to Amazon and make a purchase, I may earn a small commission. Thank you for your support.


Vanguard Target Retirement Funds – Surprise 10%+ Year-End NAV Drop and Capital Gains Distribution Explained

My Money Blog has partnered with CardRatings and may receive a commission from card issuers. Some or all of the card offers that appear on this site are from advertisers and may impact how and where card products appear on the site. MyMoneyBlog.com does not include all card companies or all available card offers. All opinions expressed are the author’s alone.

The Vanguard Target Retirement Funds are one of the largest “set-and-forget” mutual funds that own a mix of stocks and bonds that automatically adjust over time based on your targeted retirement year, with combined assets across the institutional and retail classes of over $600 billion.

Reader rp pointed out that on December 30th, 2021, many Vanguard Target Retirement funds had their price (NAV) drop by over 10% in a single day! This was mostly the result of an abnormally large year-end long-term and short-term capital gains distribution. Taken from Vanguard’s final year-end estimates PDF:

Here is an example for the Vanguard Target Retirement 2040 Fund (VFORX). The 2021 cap-gains distribution was roughly 40 times as large as for 2020. Yet, other funds with a similar asset allocation like the Vanguard LifeStrategy Funds did not have a similar result. What happened?

Background. A mutual fund is forced to make a capital gains distribution when it sells stocks (or bonds) that have appreciated in value, thus realizing capital gains. There are various reasons why a mutual fund might sell stocks:

  • An actively-managed fund might sell shares of stocks that they believe are over-valued in order to purchase shares of another business.
  • An index fund might have to sell shares if the underlying index changes. By definition, an index fund must track an index. For example, sometimes the S&P 500 will remove a company from its index.
  • A balanced mutual fund might rebalance between stocks and bonds. If the target is 80% stocks and 20% bonds, the fund might sell some stocks after a big bull run in order to buy some bonds and revert back towards the target.
  • A mutual fund has a high number of redemptions (cash outflows), such that the fund has to sell assets in order to come up with the cash to satisfy all those withdrawals.

Vanguard Target Retirement Funds don’t follow an index themselves, as they are a “fund of funds”. That means they are basically a wrapper for the component index funds. For example, the Vanguard Target Retirement 2055 Fund (VFFVX) is composed of:

  • Vanguard Total Stock Market Index Fund Investor Shares 54.90%
  • Vanguard Total International Stock Index Fund Investor Shares 35.50%
  • Vanguard Total Bond Market II Index Fund Investor Shares 6.60%
  • Vanguard Total International Bond Index Fund Investor Shares 2.80%
  • Vanguard Total International Bond II Index Fund 0.20%

However, these underlying funds did not have huge capital gains distributions themselves that might flow through. In fact, the main components had zero capital gains to distribute, while the other distributed tiny amounts less than 1%.

What we have left is that the Target Retirement Fund itself sold some shares of the component index funds. Stocks did go up in 2021, but not nearly enough to warrant such a huge capital gain. Besides, stocks also went up a similar amount in 2020, and as we saw above the 2020 capital gains distribution was 40x smaller.

In addition, the Institutional Target Retirement 2040 fund only had cap gains distributions of 0.39% of NAV. This fund should have the same rebalancing needs as the retail version for individual investors. The rest of the Institutional Target Retirement years had similarly low distributions.

Strange! Thankfully, I found a great clue by “cas” in this Bogleheads thread. From reading the annual reports for VFORX, we find that as of 3/31/21, the net assets for Target Retirement 2040 was about $35 billion. From January through September 2021, over $16 billion of shares were redeemed from the Target Retirement 2040 fund, while only $6 billion were purchased. The underlying investments grew in value, but investors took out a net $10 billion in cash over the first 9 months of 2021! The large capital gains distribution was primarily due to these large net redemptions.

Okay, but again, why? The main problem was that the “Institutional Target Retirement Funds” are not a share class of the “Target Retirement Funds”. In December 2020, Vanguard lowered the plan-level minimum investment requirement for the Institutional Target Retirement Funds to $5 million from $100 million. Now, as long as an employer’s 401k plan had $5 million in assets across the entire plan (not just one person), they could now access the much cheaper Institutional version… a big savings for possibly thousands of small businesses.

Let’s check the annual reports again. Over the same time period that Target Retirement 2040 lost $10 billion in net cash outflows, the Institutional Target Retirement 2040 Fund gained $13 billion in net cash inflows. Coincidence?

Vanguard incentivized small business retirement plans to sell their holdings from Target Retirement in order to buy Institutional Target Retirement funds by offering them a 30% to 50% reduction in fees, and they did so, moving over billions and billions.

Eventually, in September 2021, Vanguard announced that they would merge each of the Vanguard Institutional Target Retirement Funds into its corresponding Target Retirement Fund. The mergers are not scheduled to be completed until February 2022. There may be more outflows until then. A merger would not have created any forced selling, so why not do this in the first place?

I wonder if Vanguard made a mistake and they simply didn’t realize this would create large outflows. Or perhaps they just didn’t care? Either way, it’s another recent blemish on their record. The order and time delay in which they did things indirectly hurt the individual taxable investors of Target Retirement funds. They should have simply merged the two series in the first place.

This is why the DIY investor should strongly consider only investing in the “raw materials” and “cook from scratch”. VTI, VXUS, and BND ETFs can be held at any brokerage firm, bought and sold for free, distributed tax-efficiently between 401k/IRA and taxable, and are available for ETF-pair tax-loss harvesting in a taxable account. On the other hand, this is something of a one-time event, so you may value the simplicity of Target Retirement funds above the potential drawbacks.

If you like the idea of “auto-pilot” but also want to be be only one allowed to program the autopilot, check out out M1 Finance and their pies (which you can always break back up into component ETFs) as well as Utah My529 and their “customized glide path” option for college savings. I don’t like the fact that Vanguard can always change up their target asset allocation to whatever is trendy. (I have the same issues with the robo-advisors like Wealthfront and Betterment.)

Summary. Vanguard Target Retirement Funds (Investor shares) made large capital gains distributions at the end of 2021. This was mostly due to large outflows from Target Retirement Funds (owned by individual investors and small businesses) into their separate Institutional Target Retirement Funds, as Vanguard lowered the minimums for the Institutional funds from $100 million to $5 million in December 2020. This appears to have forced the Target Retirement funds so sell their investments and incur large capital gains.

If you hold Target Retirement funds in a tax-deferred accounts like 401k/403b/IRA, this has no taxable effect on you. The net asset value (NAV) dropped by a certain amount, and you received a distribution for the same amount. You most likely have it set to reinvest immediately anyway. However, if you held this in a taxable account, you received a taxable distribution. You now owe some extra tax and lost the ability to compound that money into the future. It’s not a disaster, but it did hurt your returns a little, in my view unnecessarily as Vanguard could have handled things differently on their end.

My Money Blog has partnered with CardRatings and may receive a commission from card issuers. Some or all of the card offers that appear on this site are from advertisers and may impact how and where card products appear on the site. MyMoneyBlog.com does not include all card companies or all available card offers. All opinions expressed are the author’s alone, and has not been provided nor approved by any of the companies mentioned.

MyMoneyBlog.com is also a member of the Amazon Associate Program, and if you click through to Amazon and make a purchase, I may earn a small commission. Thank you for your support.


Morningstar Safe Withdrawal Rate Report: 3.3% Base Rate + Ways To Increase It

My Money Blog has partnered with CardRatings and may receive a commission from card issuers. Some or all of the card offers that appear on this site are from advertisers and may impact how and where card products appear on the site. MyMoneyBlog.com does not include all card companies or all available card offers. All opinions expressed are the author’s alone.

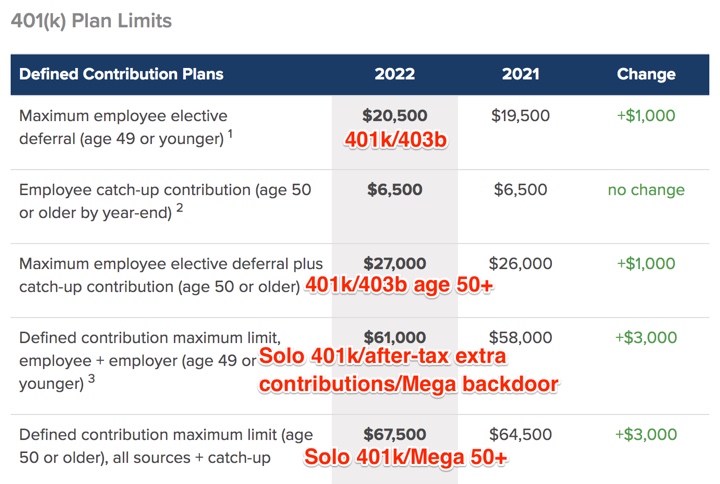
Financial freedom seekers usually have a Number – the value at which their investments can support their spending indefinitely. This is directly linked to “safe withdrawal rates”. For example a 4% safe withdrawal rate is a 25x multiplier – meaning $30,000 in spending needs not covered by Social Security, annuities, or pensions would require 25 x $30,000 = $750,000. Morningstar recently released a 59-page research paper called The State of Retirement Income: Safe Withdrawal Rates (summary article) that digs deeper into the “4% rule”. The headline is that they now estimate 3.3% a conservative base rate (30x multiplier):

What’s a safe withdrawal rate for retirees? We estimate 3.3%. However, there are various factors that could affect this percentage, resulting in the retiree withdrawing a significantly higher amount. This report explores ways that retirees can make their savings last longer without compromising their standard of living.

Instead of focusing on the 3.3% base rate, look at the various ways you can improve it. The 3.3% base rate assumes a 50% stock/50% bond portfolio, fixed withdrawals (adjusted upwards for inflation annually, no matter what) over a 30-year time horizon, and a 90% probability of success. What if you changed up some of these assumptions?

Lever #1: Hold a higher percentage of stocks. Historically, having a minimum amount of stocks is important in order to outpace inflation. However, going past 50% to 75% stocks no longer helps your minimum safe withdrawal rate. Not much room for improvement here.

Lever #2: Tolerate lower safety (success rate). This chart is useful to help accept the role of luck for a stock-based retirement portfolio. The fact is that 50% of the time, you could have withdrawn 4.7% and been just fine. You simply don’t know. (This is hard for me as a planner.) The retiree “Class of 2011” could have spent more than that so far without even denting their nest egg. However, the “Class of 2021” may have a very different experience. Going down to 80% probability of success moves you up from 3.3% to 3.9%.

Lever #3: Don’t keep adjusting upward for inflation. Your personal inflation rate might not keep up with the national averages. You might very well spend less as you age. If you adjust for 3/4th of inflation, that 3.3% goes up to 3.6%.

Forgoing inflation adjustments–at least in part–is another lever. That might seem farfetched in the current environment, given that inflation is top of mind. But research from David Blanchett, formerly of Morningstar but now at PGIM, has demonstrated that retirement spending doesn’t necessarily track inflation and often trends down throughout the lifecycle. Our research shows that the retiree who adjusts his or her paycheck by just 75% of the actual inflation rate would be able to take a starting withdrawal of 3.6%, for example.

Lever #4: Work longer. Make more money, make retirement period shorter. Not much fun, but effective. My view is that any amount of income will help reduce your withdrawal rate, if you have the time and ability. It is less common nowadays to go from full-time job to zero income. Working 10 hours a week feels much different than 40-50 hours a week.

Reducing the time horizon for drawdown–for example, by delaying retirement a few years–can likewise contribute to a higher starting safe withdrawal rate. For example, delaying retirement by five years and truncating the in-retirement spending horizon to 25 years from 30 results in a starting safe withdrawal amount of 4.1%.

Lever #5: Flexible spending based on market performance. There are several ways that you could adjust your spending in retirement in response to your portfolio’s return. In general, you’d want to spend less when the market is down. Some of this will come naturally as it’s easier to cut back on spending when you see your friends and neighbors cutting back as well. However, I was surprised to see that several of the proposed methods really don’t change the numbers much.

The method that does help significantly is called the Guyton-Klinger “guardrails” method, which allows inflation adjustments but applies “guardrails” so that the spending rate stays within 20% of the initial withdrawal percentage. Lets say your initial percentage is 4%. If markets go sky-high, the guardrails let you spend at least 3.2% of your new portfolio value (with inflation adjustments). If markets plummet, the guardrails let you spend at most 4.8% of your new portfolio value (with inflation adjustments).

Hold up! Early Retirement Now has an excellent post about how the Guyton-Klinger guardrails are much more “variable” than just +/- 20%. The guardrails move with the portfolio value. If you started out taking $40,000 out of a $100,000 portfolio, by following this rule starting in 1966, your income would have dropped to below $20,000 a year! A 50% drop in income is far too flexible for most people.

My personal thoughts. Every year that passes, I pay less attention to historical backtests and precise safe withdrawal rates. Instead, I care more about understanding the earning power of the assets that I own (including my own skills), and understanding the structure and flexibility of my expenses.

In regards to market returns, it is better to be lucky than anything else. Let’s say you retired about a year ago on October 31st, 2020 and owned the Vanguard Balanced Index Fund (VBIAX) that is 60% US stocks and 40% US bonds. If you had a $1,000,000, a 4% withdrawal rate is $40,000. But a year later, on October 31st, 2021, your portfolio would be just shy of $1,200,000 ($1,195,584) even after taking out $40,000 during the first year. This is just after one year!

In other words, 3.3% could easily be obsolete in a year. You are multiplying a safe withdrawal rate by something that can easily move up or down 20% each year, so why care about decimal points? Focus on what you can control. Looking back at all the levers above, here is what I can control:

  • Accept that a stock-based retirement portfolio will rely on luck. 3% = very safe. 4% = probably safe. 5% = risky. 6% = not safe.
  • Keep your portfolio in retirement somewhere between 50% and 75% stocks, with the rest in investment-grade bonds.
  • Don’t blindly keep taking out more money each year for inflation.
  • Working longer may be required, but explore ways to downshift while still making some income. Even small amounts of income make a difference. For example, 1% of $750,000 is $7,500 per year ($144/week). Earning $144 per week in income would move you from a 5% withdrawal rate to a 4% withdrawal rate, from a 4% withdrawal rate to a 3% withdrawal rate, and so on.
  • Don’t plan to spend the same amount every year. Spend less when markets are down, as most people do anyway. Think about the flex in your budget. Don’t lock in long-term commitments (vacation home ownership, any debt, agreements to pay for your kid’s X). Pick things that you can shut off (vacation rentals, travel, dining out).
My Money Blog has partnered with CardRatings and may receive a commission from card issuers. Some or all of the card offers that appear on this site are from advertisers and may impact how and where card products appear on the site. MyMoneyBlog.com does not include all card companies or all available card offers. All opinions expressed are the author’s alone, and has not been provided nor approved by any of the companies mentioned.

MyMoneyBlog.com is also a member of the Amazon Associate Program, and if you click through to Amazon and make a purchase, I may earn a small commission. Thank you for your support.