Be Guaranteed to Own the World’s Most Valuable Companies in 2051

My Money Blog has partnered with CardRatings and may receive a commission from card issuers. Some or all of the card offers that appear on this site are from advertisers and may impact how and where card products appear on the site. MyMoneyBlog.com does not include all card companies or all available card offers. All opinions expressed are the author’s alone.

The 2021 Berkshire Hathaway Annual Shareholder Meeting was on May 1st, 2022 and is now available as a recorded video on Yahoo Finance and a handy Rev.com transcript. I expect the podcast version to be updated shortly. I recommend listening or reading on your own, as I always find valuable tidbits outside the media highlights.

Buffett started out with the 2021 version of his annual advice for the average investor that doesn’t read 10-K SEC filings, shareholder annual reports, and multiple newspapers in their entirety every day: buy index funds. Buffett created a few slides for those “new entrants” who might think stock market investing means trading 25 times a day on Robinhood.

Here are the 20 most valuable companies in the world as of March 31st, 2021. The list includes 13 from the United States, three from China, and one each from Saudi Arabia, Taiwan, South Korea, and France.

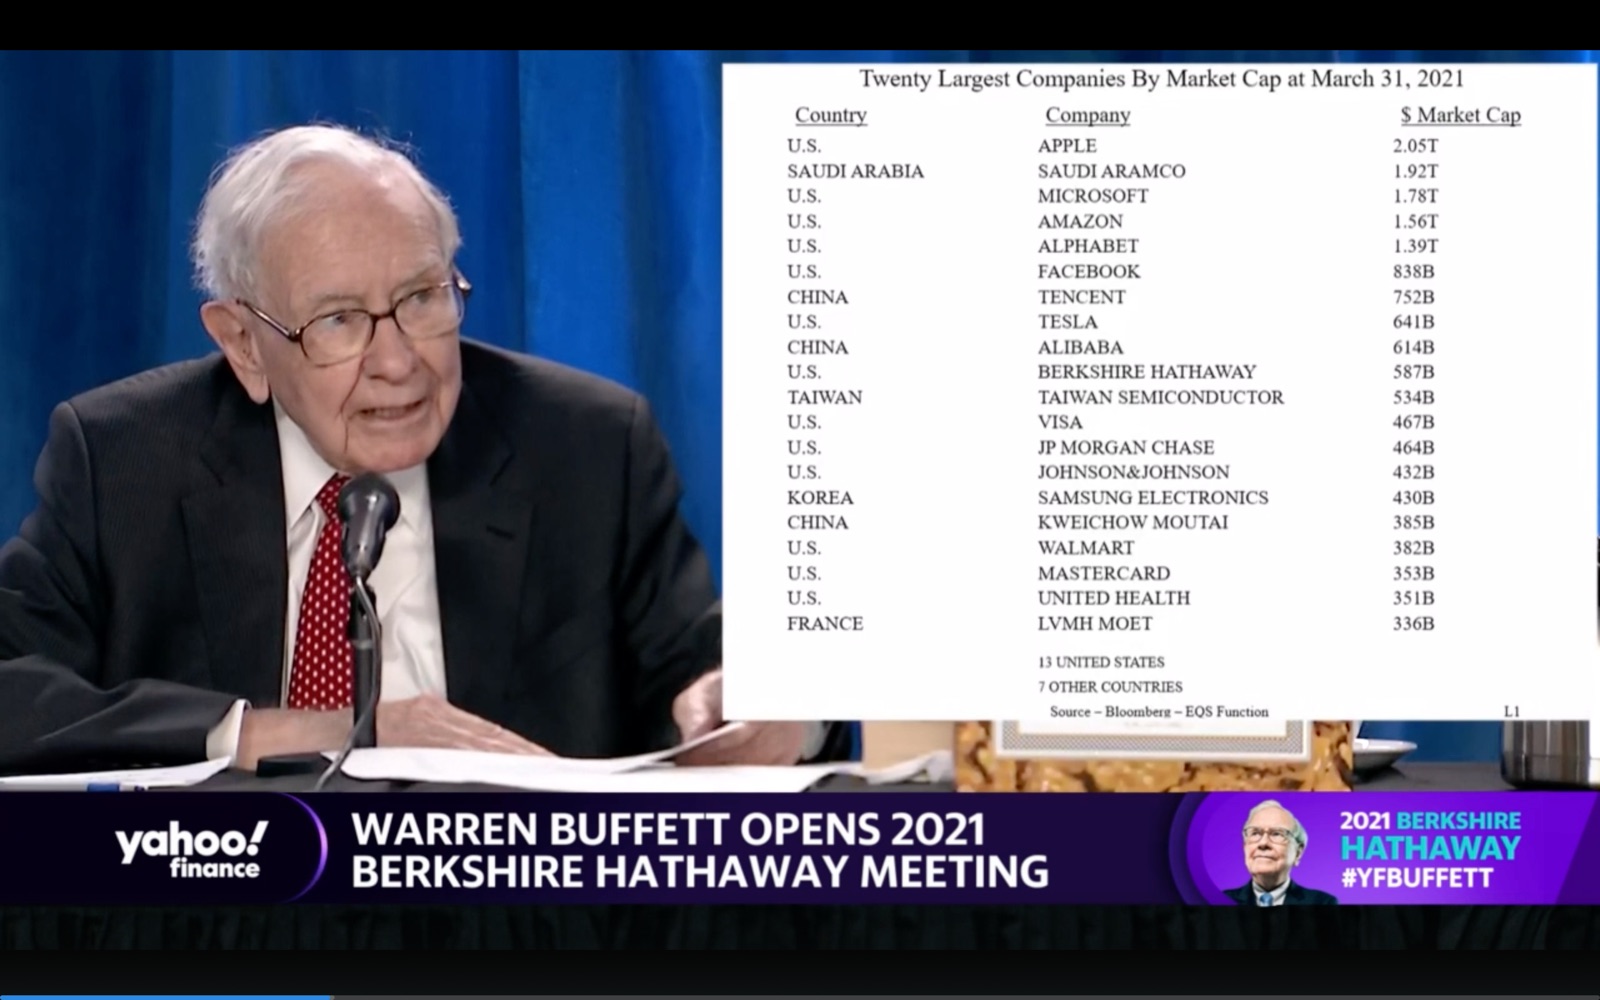
He then asks “How many of these companies do you think will be on this same Top 20 list in 30 years? (2051)”

8?

5?

Once you have the answer in mind, you can consider this list of the 20 most valuable companies in the world from ~30 years ago (1989).

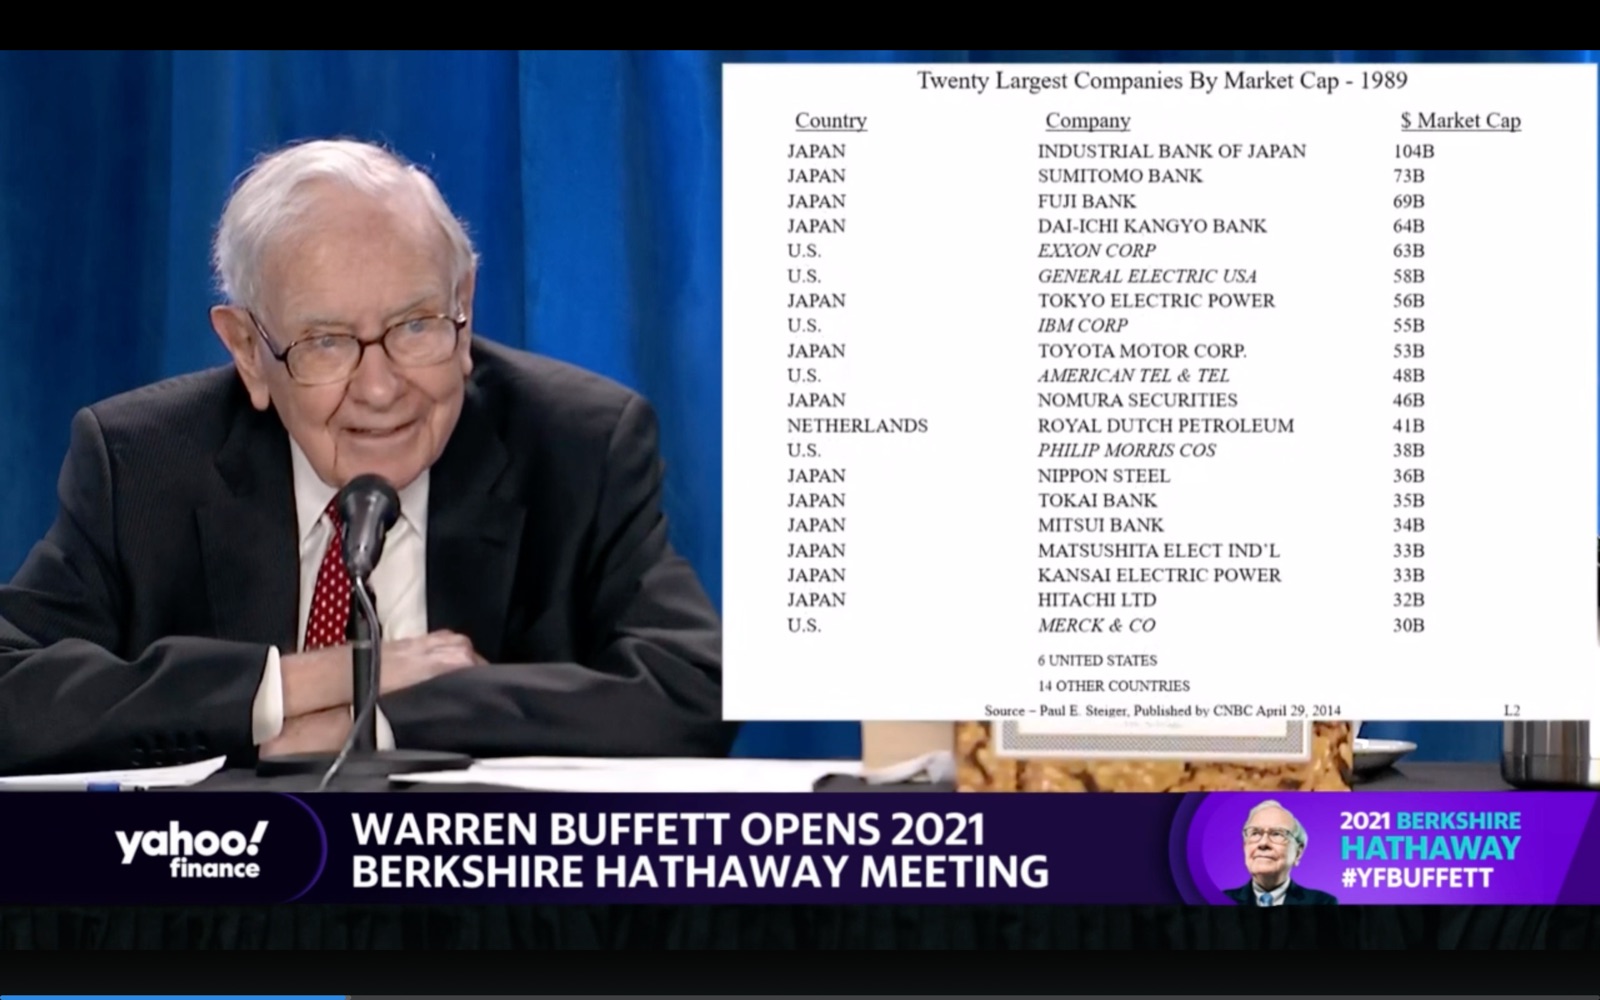
There is zero overlap in the two lists in regards to actual companies. Some names might be familiar, but not a single company stayed in the top 20. The 1989 list includes 13 from Japan, 6 from the United States, and one from the Netherlands.

In 1989, the most valuable company was worth $100 billion. (That company, the Industrial Bank of Japan, later merged with another business and that new company is only worth $37 billion in 2021.) Meanwhile, the most valuable company of 2021 is worth over $2,000 billion, a 20X increase.

If you are under the age of 50, you are a time billionaire. Your time horizon is a billion seconds (30 years) or longer. Many things will change over that period. Hopefully you will enjoy a happy, fulfilling life. But if you own a low-cost, market-cap weighted index fund, you will be guaranteed to own the world’s largest companies in 2051. As the late Jack Bogle told us: “Don’t look for the needle in the haystack. Just buy the haystack.” He might have added “…and get on with your life!”.

This comparison also shows why I remain diversified internationally, even though it hasn’t paid off recently. Does anyone really know that the future holds in regards to world geopolitics? It’s possible the US companies will continue to outperform for another 30 years. I hope so, and if that happens then I’ll hold a large majority of US stocks in the future. It will work itself out.

My Money Blog has partnered with CardRatings and may receive a commission from card issuers. Some or all of the card offers that appear on this site are from advertisers and may impact how and where card products appear on the site. MyMoneyBlog.com does not include all card companies or all available card offers. All opinions expressed are the author’s alone, and has not been provided nor approved by any of the companies mentioned.

MyMoneyBlog.com is also a member of the Amazon Associate Program, and if you click through to Amazon and make a purchase, I may earn a small commission. Thank you for your support.


The Intriguing History of the 30-Year Fixed Rate Mortgage

My Money Blog has partnered with CardRatings and may receive a commission from card issuers. Some or all of the card offers that appear on this site are from advertisers and may impact how and where card products appear on the site. MyMoneyBlog.com does not include all card companies or all available card offers. All opinions expressed are the author’s alone.

As part of a complete personal finance education, I submit that the longread article Financing the American Home by Marc Rubenstein should also be required reading. I learned a lot of important facts about the history and meaning behind the 30-year fixed-rate fully prepayable mortgage:

From the consumer’s perspective, it’s an amazing product. It’s a simple loan that offers stable repayments, kept low because they are spread out over such a long period of time. Its kicker is a free option to prepay, which shields the borrower from interest rate risk. If rates go up, borrowers can commend themselves on a great bargain; if they go down, stay calm—the loan can be refinanced without penalty. Win/win.

You’ll only find it in the United States (except for one small European country):

Yet, with the exception of Denmark, it doesn’t exist anywhere else in the world. Even baseball exists in more countries.

Which leads to an interesting observation:

To many, the idea that the US, a beacon of the free market, should support its mortgage market so directly seems odd. The former Governor of the Bank of England, Mervyn King, once remarked: “You Americans are so strange. Most countries have socialised healthcare and a private market in mortgages. You have socialised mortgages and a private market in healthcare.

The article goes on to explore how individual homeownership as a widespread goal has been widely accepted in the US for hundreds of years. Yet, every time the US government tries to shift the mortgage market back towards free-market capitalism, there are no takers. The 30-year fixed mortgage is a clear example of government subsidization (even though they try to obscure it). If the government were to exit the market today and remove their backstop guarantee, mortgage rates (and home values) would have to find a new market-based equilibrium. In other words: tighter lending standards, higher interest rates, and thus at least somewhat lower home values.

So we should be really happy that we have the 30-year fixed mortgage and never pay it off, right? Cheap, dependable leverage forever! I happen to also be reading the book How I Invest My Money by Joshua Brown and Brian Portnoy, where “25 finance experts reveal how they save, spend, and invest”. I’m only about six interview in, but you know what every. single. person. has in common so far? They own their primary home, outright with no mortgage! So even with all of the potential financial benefits of low interest rates, tax deductions, and refinance optionality, they felt the psychological benefits outweighed all of that. Wow. These familiar names that I’ve read and linked to many times, including Joshua Brown, Morgan Housel, Christine Benz, and Bob Seawright (with more to add I’m sure) – they’ve all gotten “the letter” that we got when we paid off our mortgage:

So what’s the best move? Here’s my two cents. If you want to own a home and live in it for the foreseeable future, then buy one for both psychological and financial reasons. Use that nifty 30-year fixed mortgage, but don’t necessarily borrow the max that they’ll allow. Then roughly time the mortgage payoff with your retirement date. Love your awesome job and want to work until 65? Then take your time. Serious about early financial independence? Then refinance or prepay principal to shorten the term, and pay it off as part of one of your final retirement goals. I have to agree that a paid-off primary residence offers well-being benefits that are hard to put a price upon.

My Money Blog has partnered with CardRatings and may receive a commission from card issuers. Some or all of the card offers that appear on this site are from advertisers and may impact how and where card products appear on the site. MyMoneyBlog.com does not include all card companies or all available card offers. All opinions expressed are the author’s alone, and has not been provided nor approved by any of the companies mentioned.

MyMoneyBlog.com is also a member of the Amazon Associate Program, and if you click through to Amazon and make a purchase, I may earn a small commission. Thank you for your support.


Fidelity Spire App $100 Bonus, Fidelity Go Roboadvisor Warning

My Money Blog has partnered with CardRatings and may receive a commission from card issuers. Some or all of the card offers that appear on this site are from advertisers and may impact how and where card products appear on the site. MyMoneyBlog.com does not include all card companies or all available card offers. All opinions expressed are the author’s alone.

Updated, including new bonus and tax warning. Fidelity Spire is Fidelity’s new mobile app, which adds fintech-y features and is separate from their main Fidelity app. You can link your external accounts, track balances, and set financial goals. (Fidelity acquired fintech startup eMoney in 2015, and is using that technology for account aggregation.) You can also link up “real” Fidelity accounts like their brokerage accounts and perform commission-free trades within the app.

New $100 Fidelity account bonus. If you open a new, eligible Fidelity account via the Spire app or fidelity.com/spire and maintain an automatic monthly deposit of $25+ for 6 months, you can get a $100 bonus. Hat tip to DoC.

  • You must open via the Fidelitiy Spire app or specific link above, not anywhere else.
  • Eligible accounts include The Fidelity Account®, Fidelity® Cash Management account, Fidelity Roth IRA, or a Fidelity traditional IRA.
  • You must establish a monthly Fidelity Automatic Account Builder (FAAB) plan, an automated deposit feature, on your newly established account for at least $25. First deposit must be within 45 days of opening, and must come from an external, non-Fidelity source. The automatic monthly deposit must remain in effect for at least 6 months (or 6 monthly deposits of at least $25).
  • Bonus limited to $100 per individual in 2021.

Fidelity doesn’t offer bonuses very often, so even though it is not that big, it’s still something if you were planning on opening an account anyway.

While not eligible for the bonus, they are also offering their new Fidelity Go robo-advisor service that automatically invests for you, with no minimum to start and the following fee structure:

  • $10,000 or less: No advisory fee
  • $10,000 to $49,999: Flat $3 a month
  • $50,000 or more: 0.35% annually

The flat fee structure for assets under $50,000 is interesting. At $10,000 in assets, $36 dollars a year = 0.36% annually. At $49,999 in assets, $36 dollars a year = 0.07% annually.

In addition, the underlying mutual funds also offer zero expense ratios. Fidelity actually created a new line of mutual funds called Fidelity Flex Funds for their managed accounts, similar to their other passive and actively-managed mutual funds but with zero expense ratios. For example, there is a Fidelity Flex 500 Fund and a Fidelity Flex International Index fund. However, this special also comes with a drawback.

As with other roboadvisors, the portfolio they choose will be based on you filling out a relatively short online questionnaire. If you aren’t sure about the resulting asset allocation, I recommend going back and change your answers to see the effects. With Fidelity Go, you do not gain access to financial advice from a human advisor. However, you will still gain access to their phone/live chat customer service, which has traditionally been rated highly.

Warning: If you decide to move your money out of Fidelity Go in a taxable account, they will force you to sell all your proprietary Flex fund shares and potentially incur capital gains taxes. If you just owned regular ETFs or mutual funds, you should be able to export the shares “in-kind” without selling and maintain your cost basis. I know you can do this with Betterment and Wealthfront. Depending on how much your account grew, you could consider this a significant “exit fee”.

This is why I still prefer to DIY and construct a portfolio using “high-quality interchangeable parts” that I can keep forever. You can still use Fidelity as I think they are reputable firm with overall good customer service, but instead just buy something like Vanguard Total US Market ETF (VTI) or iShares Core Total US (ITOT).

With free trades now available nearly everywhere, the primary “cost” is the hassle of doing the trades yourself. This is why I recommend also looking at M1 Finance, as they will maintain your target asset allocation for free while still allowing your the ability to port out your investments at any time.

My Money Blog has partnered with CardRatings and may receive a commission from card issuers. Some or all of the card offers that appear on this site are from advertisers and may impact how and where card products appear on the site. MyMoneyBlog.com does not include all card companies or all available card offers. All opinions expressed are the author’s alone, and has not been provided nor approved by any of the companies mentioned.

MyMoneyBlog.com is also a member of the Amazon Associate Program, and if you click through to Amazon and make a purchase, I may earn a small commission. Thank you for your support.


MMB Portfolio Update April 2021: Dividend and Interest Income

My Money Blog has partnered with CardRatings and may receive a commission from card issuers. Some or all of the card offers that appear on this site are from advertisers and may impact how and where card products appear on the site. MyMoneyBlog.com does not include all card companies or all available card offers. All opinions expressed are the author’s alone.

dividendmono225

While my April 2021 portfolio asset allocation is designed for total return, I also track the income produced. Stock dividends are the portion of profits that businesses have decided they don’t need to reinvest into their business. The dividends may suffer some short-term drops, but over the long run they have grown faster than inflation. Here is the historical growth of the S&P 500 absolute dividend (source):

This is true despite the fact that the S&P 500 yield percentage are again near historical lows, along with interest rates (source):

I track the “TTM” or “12-Month Yield” from Morningstar, which is the sum of the trailing 12 months of interest and dividend payments divided by the last month’s ending share price (NAV) plus any capital gains distributed over the same period. I prefer this measure because it is based on historical distributions and not a forecast. Below is a rough approximation of my portfolio (2/3rd stocks and 1/3rd bonds).

Asset Class / Fund % of Portfolio Trailing 12-Month Yield (Taken 4/11/21) Yield Contribution
US Total Stock
Vanguard Total Stock Market Fund (VTI, VTSAX)
25% 1.37% 0.36%
US Small Value
Vanguard Small-Cap Value ETF (VBR)
5% 1.59% 0.08%
International Total Stock
Vanguard Total International Stock Market Fund (VXUS, VTIAX)
25% 2.13% 0.53%
Emerging Markets
Vanguard Emerging Markets ETF (VWO)
5% 1.86% 0.09%
US Real Estate
Vanguard REIT Index Fund (VNQ, VGSLX)
6% 3.50% 0.24%
Intermediate-Term High Quality Bonds
Vanguard Intermediate-Term Treasury ETF (VGIT)
17% 1.43% 0.26%
Inflation-Linked Treasury Bonds
Vanguard Short-Term Inflation-Protected Securities ETF (VTIP)
17% 1.37% 0.20%
Totals 100% 1.73%


Trailing 12-month yield history. Here is a chart showing how this 12-month trailing income rate has varied since I started tracking it in 2014.

Portfolio value reality check. One of the things I like about using this number is that when stock prices drop, this percentage metric usually goes up – which makes me feel better in a bear market. When stock prices go up, this percentage metric usually goes down, which keeps me from getting too euphoric during a bull market.

Here’s a related quote from Jack Bogle (source):

The true investor… will do better if he forgets about the stock market and pays attention to his dividend returns and to the operating results of his companies.

This quarter’s trailing income yield of 1.73% is the lowest ever since 2014. This is nearly a full 1% lower than what it was in late 2018. At the same time, my portfolio value is also bigger than ever. If you retired back in say, 2015, your absolute income from dividends and interest is much higher in 2021, even though your yield percentage is lower. You had a good run right after retirement.

However, this is not necessarily good news if you are retiring today. There are countless articles debating this topic, but I historically support a 3% withdrawal rate as a reasonable target for planning purposes if you want to retire young (before age 50) and a 4% withdrawal rate as a reasonable target if retiring at a more traditional age (closer to 65). However, nobody is guaranteeing these numbers and flexibility may be required if there is a bad stock run right after retirement. The “good ole’ days” included the ability to put your money in a CD or high-quality bond and still keep up with inflation…

If you are not close to retirement, there is not much use worrying about it now. Your time is better spent focusing on earning potential via better career moves, investing in your skillset, and/or looking for entrepreneurial opportunities where you own equity in a business asset.

How we handle this income. Our dividends and interest income are not automatically reinvested. I treat this money as part of our “paycheck”. Then, as with a real paycheck, we can choose to either spend it or invest it again. Even if still working, you could use this money to cut back working hours, pursue new interests, start a new business, travel, perform charity or volunteer work, and so on.

My Money Blog has partnered with CardRatings and may receive a commission from card issuers. Some or all of the card offers that appear on this site are from advertisers and may impact how and where card products appear on the site. MyMoneyBlog.com does not include all card companies or all available card offers. All opinions expressed are the author’s alone, and has not been provided nor approved by any of the companies mentioned.

MyMoneyBlog.com is also a member of the Amazon Associate Program, and if you click through to Amazon and make a purchase, I may earn a small commission. Thank you for your support.


MMB Portfolio Update April 2021: Asset Allocation & Performance

My Money Blog has partnered with CardRatings and may receive a commission from card issuers. Some or all of the card offers that appear on this site are from advertisers and may impact how and where card products appear on the site. MyMoneyBlog.com does not include all card companies or all available card offers. All opinions expressed are the author’s alone.

portpie_blank200

Here’s an update on my current investment holdings as of April 2021, including our 401k/403b/IRAs, taxable brokerage accounts, and savings bonds but excluding our house, cash reserves, and a small portfolio of self-directed investments. Following the concept of skin in the game, these are my real-world holdings and what I’ll be using to create income to fund our household expenses. We have no pensions or other sources of income.

Actual Asset Allocation and Holdings
I use both Personal Capital and a custom Google Spreadsheet to track my investment holdings. The Personal Capital financial tracking app (free, my review) automatically logs into my different accounts, adds up my various balances, tracks my performance, and calculates my overall asset allocation. Once a quarter, I also update my manual Google Spreadsheet (free, instructions) because it helps me calculate how much I need in each asset class to rebalance back towards my target asset allocation.

Here are updated performance and asset allocation charts, per the “Allocation” and “Holdings” tabs of my Personal Capital account, respectively:

Stock Holdings
Vanguard Total Stock Market (VTI, VTSAX)
Vanguard Total International Stock Market (VXUS, VTIAX)
Vanguard Small Value (VBR)
Vanguard Emerging Markets (VWO)
Vanguard REIT Index (VNQ, VGSLX)

Bond Holdings
Vanguard Limited-Term Tax-Exempt (VMLTX, VMLUX)
Vanguard Intermediate-Term Tax-Exempt (VWITX, VWIUX)
Vanguard Intermediate-Term Treasury (VFITX, VFIUX)
Vanguard Inflation-Protected Securities (VIPSX, VAIPX)
Fidelity Inflation-Protected Bond Index (FIPDX)
iShares Barclays TIPS Bond (TIP)
Individual TIPS bonds
U.S. Savings Bonds (Series I)

Target Asset Allocation. I do not spend a lot of time backtesting various model portfolios, as I don’t think picking through the details of the recent past will necessarily create superior future returns. Usually, whatever is popular in the moment just happens to hold the asset class that has been the hottest recently as well.

Mainly, I try to own broad, low-cost exposure to asset classes that will provide long-term returns above inflation, distribute income via dividends and interest, and finally offer some historical tendencies to balance each other out. I make a small bet that US Small Value and Emerging Markets will have higher future long-term returns (along with some higher volatility) than the more large and broad indexes, although I could be wrong.

While you could argue for various other asset classes, I believe that it is important to imagine an asset class doing poorly for a long time, with bad news constantly surrounding it, and only hold the ones where you still think you can maintain faith through those fearful times. I simply don’t have strong faith in the long-term results of commodities, gold, or bitcoin. (In the interest of full disclosure, I do own tiny bits of gold and BTC amongst my self-directed investments.)

My US/international ratio floats with the total world market cap breakdown, currently at ~57% US and 43% ex-US. I’m fine with a slight home bias (owning more US stocks than the overall world market cap), but I want to avoid having an international bias.

Stocks Breakdown

  • 43% US Total Market
  • 7% US Small-Cap Value
  • 33% International Total Market
  • 7% Emerging Markets
  • 10% US Real Estate (REIT)

Bonds Breakdown

  • 33% High-Quality Nominal bonds, US Treasury or FDIC-insured
  • 33% High-Quality Municipal Bonds
  • 33% US Treasury Inflation-Protected Bonds

I have settled into a long-term target ratio of 67% stocks and 33% bonds (2:1 ratio) within our investment strategy of buy, hold, and occasionally rebalance. I will use the dividends and interest to rebalance whenever possible in order to avoid taxable gains. I plan to only manually rebalance past that if the stock/bond ratio is still off by more than 5% (i.e. less than 62% stocks, greater than 72% stocks). With a self-managed, simple portfolio of low-cost funds, we minimize management fees, commissions, and taxes.

Holdings commentary. Overall, all these numbers keep going up since the March 2020 drop, but I remain anxious about the future. There seems to be lots of money and optimism sloshing around, but there are also so many people still struggling. All I can do is listen to the late Jack Bogle and “stay the course”. I remain optimistic that capitalism, human ingenuity, human resilience, and our system of laws will continue to improve things over time.

In specific terms, I seem to be a little overweight REITs and underweight International Stocks. I may rebalance within tax-deferred accounts if this continues.

I have also been following with interest the new ETFs from both Dimensional Fund Advisors and Avantis (started by former DFA employees). Right now, I don’t need to rebalance out of anything, but in the future I may purchase the DFA Emerging Core Equity Market ETF (DFAE) and Avantis U.S. Small Cap Value ETF (AVUV) instead of my current holdings.

Performance numbers. According to Personal Capital, my portfolio is already up +5.6% since the beginning of 2021. Wow. I rolled my own benchmark for my portfolio using 50% Vanguard LifeStrategy Growth Fund and 50% Vanguard LifeStrategy Moderate Growth Fund – one is 60/40 and the other is 80/20 so it also works out to 70% stocks and 30% bonds. That benchmark would have a total return of +5.2% for 2020 YTD as of 4/9/2021.

The goal of this portfolio is to create sustainable income that keeps up with inflation to cover our household expenses. I’ll share about more about the income aspect in a separate post.

My Money Blog has partnered with CardRatings and may receive a commission from card issuers. Some or all of the card offers that appear on this site are from advertisers and may impact how and where card products appear on the site. MyMoneyBlog.com does not include all card companies or all available card offers. All opinions expressed are the author’s alone, and has not been provided nor approved by any of the companies mentioned.

MyMoneyBlog.com is also a member of the Amazon Associate Program, and if you click through to Amazon and make a purchase, I may earn a small commission. Thank you for your support.


The Most Popular Ages When People Actually Claim Social Security

My Money Blog has partnered with CardRatings and may receive a commission from card issuers. Some or all of the card offers that appear on this site are from advertisers and may impact how and where card products appear on the site. MyMoneyBlog.com does not include all card companies or all available card offers. All opinions expressed are the author’s alone.

Although I’m still decades away from Social Security, I see a constant stream of articles about the “best” time to start taking benefits. Often, you are told to delay claiming until age 70, as you will receive a more valuable, inflation-adjusted, government-guaranteed payout for the rest of your life. But if you have a spouse, it may be better for one of them to claim as early as possible, at age 62. There are many calculators out there – here is one free tool for Optimal Social Security Claiming Strategy.

Apart from the theoretically optimal, when do people actually start taking Social Security? Here is a chart from this Morningstar article (which otherwise includes a lot of speculation):

The three most popular times are:

  • Age 62: As early as possible. Many people feel that they have little choice but to ask for the money the moment it is available. Some have health issues which change the odds against waiting. Some just want the bird in the hand now. Finally, this may be the mathematically optimal strategy for one member of a couple. Together, this makes ASAP the most popular choice by far.
  • Age 66: “Full” retirement. Although there is nothing technically magical about the age 66, it is called “full retirement age” for people retiring in 2019. This is when you’ll get “100%” of your “full” benefits, and anything less is called a “benefit reduction” and anything more is called an “benefit increase”. I wonder if behavior would change if they changed their wording? They could, for example, also just call 62 the base age and call everything after that a benefit increase.
  • Age 70: As late as possible. In order to decline “free” money from the government for 8 years, you must believe in your odds of having an average/above-average life expectancy and have enough financial assets to pay for your expenses during the wait. Less than 10% of people go this route. Your reward is a monthly benefit that is 33% higher than claiming at age 66, and 76% more than claiming at age 62. This increased income will also increase with inflation each year, and inflation-adjusted annuities are only sold by a few insurance companies and are quite expensive.

This matches my anecdotal experience from family and friends. Most people don’t consult a complicated calculator. They either take it as soon as they can for whatever reason, or they “follow the rules” and take it at the “full” retirement age. I’ll probably cough up the money for a calculator when the time comes.

My Money Blog has partnered with CardRatings and may receive a commission from card issuers. Some or all of the card offers that appear on this site are from advertisers and may impact how and where card products appear on the site. MyMoneyBlog.com does not include all card companies or all available card offers. All opinions expressed are the author’s alone, and has not been provided nor approved by any of the companies mentioned.

MyMoneyBlog.com is also a member of the Amazon Associate Program, and if you click through to Amazon and make a purchase, I may earn a small commission. Thank you for your support.


Four Pillars of Retirement: Money, Purpose, People, and Health

My Money Blog has partnered with CardRatings and may receive a commission from card issuers. Some or all of the card offers that appear on this site are from advertisers and may impact how and where card products appear on the site. MyMoneyBlog.com does not include all card companies or all available card offers. All opinions expressed are the author’s alone.

While it is understandable that most talk about “retirement planning” concerns money, a truly successful retirement requires more than that. Coincidentally, the same week I was pondering the Components of Happiness, I also stumbled upon a 6-year leanFIRE update from LivingaFI. It was a very honest and thoughtful story of someone who carefully planned and quit their job at age 37. I usually focus on my reason for financial indepedence as “spending my time as I wish”, but now I realize that it may help to specifically address certain areas regularly.

For your consideration, here are The Four Pillars of Retirement*:

  • Money: You need enough money to pay for housing, transportation, food, healthcare, and everything sold at Walmart/Target/Amazon/Costco.
  • Purpose: You need to feel that you are useful, moving forward, pursuing a goal, and/or making the world a tiny bit better.
  • People: You need love. Love and social interaction from your life partner, children, family, friends, and/or animal companions.
  • Health: You need to feel physically healthy, or be at peace with your level of health.

Imagine each pillar as one of the legs of a square table. We have to maintain and shore up any cracks before it gets serious. If you are lacking in any one of these pillars, your retirement gets wobbly. If any two are crumbling, that’s enough to make the entire thing tip over.

Most people say that they hate work, but working takes care of more than just the money pillar. In addition to income, work can provide a sense of purpose and self-worth, as well as a wide social circle. Some people just like having something fixed to build their routine around; they flounder with “nothing to do”. People often imagine retirement as a perpetual weekend – playing golf, eating out, travel, shopping, etc. – but it can get weird when all your friends are still working. Here is a WSJ article on how leaving work can put a lot of strain on couples.

It can be difficult to get out of the “I must be busy and productive” mindset. When you retire, use the opportunity to sit in the quiet and ponder what is most important to you. Choose your hard thing.

Finally, even if you have done all you can to be prepared, life still happens. The author of LivingaFi had nearly $1 million in assets, reasonable expenses, a committed life partner with a similar level of assets, lots of outside interests, and good health. This is not judgment, but a scary reminder for all of us: jobs, bull markets, relationships and good health can all end faster than you think. Your actions matter, but luck matters too. For example, the Social Security Administration says that a 20-year-old worker has a 1-in-4 chance of being disabled before retirement age. (Where available, we should buy adequate life, health, and disability insurance.)

My biggest blind spot was that if you have children, any one of them may also develop a health condition or other special needs that may require additional financial support indefinitely. I really didn’t appreciate the hidden struggles that so many families go through that is no fault of their own. I also didn’t fully appreciate how lucky I was to not have to deal with any of these things while growing up as a kid.

If you accept that luck matters in your investments, then the optimal choice might be to retire earlier with a more modest amount so that if things go well, you get more retirement years, but if things go badly, then you fall back on some part-time back-up work. Being willing to be flexible can pay off. You have to balance your odds of running out of money with the odds of running out of time.

On the other hand, if you are a high-earner, it might be better to work “One More Year” while you work on planning for the other pillars. Finding a new purpose, finding new friends, finding a new routine, it can be quite difficult. Looking back, I am thankful that we did not attempt to retire early and instead adjusted our hours (and income) downward while still keeping our foothold in the workforce. I’m still working on these pillars myself, but our middle path has worked well for us.

(* A nod to the classic The Four Pillars of Investing, one of the first investing books I ever read and reviewed here way back in 2004.)

My Money Blog has partnered with CardRatings and may receive a commission from card issuers. Some or all of the card offers that appear on this site are from advertisers and may impact how and where card products appear on the site. MyMoneyBlog.com does not include all card companies or all available card offers. All opinions expressed are the author’s alone, and has not been provided nor approved by any of the companies mentioned.

MyMoneyBlog.com is also a member of the Amazon Associate Program, and if you click through to Amazon and make a purchase, I may earn a small commission. Thank you for your support.


Scott Galloway’s Algebra of Wealth (or: How To Become Rich)

My Money Blog has partnered with CardRatings and may receive a commission from card issuers. Some or all of the card offers that appear on this site are from advertisers and may impact how and where card products appear on the site. MyMoneyBlog.com does not include all card companies or all available card offers. All opinions expressed are the author’s alone.

Scott Galloway shares in The Algebra of Wealth his thoughts on how to achieve financial security (be rich). You should read the entire thing, but the ingredients in his formula are Focus, Stoicism, Time, and Diversification. I’m only including a few notes and personal interpretations here.

Focus. If you want to get rich, you have consciously take action to make it happen. It rarely happens by accident. Look for a good wave to ride when you are young. Look carefully for the right life partner.

Successful people often unwittingly head fake young people with the humblebrags of “follow your passion” and “don’t think about money.” This is (mostly) bullshit. Achieving economic security requires hard work, talent, and a tremendous amount of focus on . . . money. Yes, some people’s genius will be a tsunami that overwhelms a lack of focus and discipline. Assume you are not that person.

Stoicism. Develop some self-discipline and character. Be generous and helpful to others. This will help you spend less money.

Determine what you can and can’t control. You can control your reactions to temptation — a lack of discipline is the antichrist to economic security. Our society of superabundance makes this difficult. Billions of dollars are spent every year on schemes to manipulate our natural impulses into spending more money, consuming more fat, and believing everyone around us is more successful than we are. The upgrade from economy to premium to business to first class to private jet can seem like an investment in yourself — it’s not. The most powerful forward-looking indicator of your financial freedom is not how much you earn, but how much you save.

Time. Steady improvements over time can supercharge your results. Don’t focus only on the short-term. As the saying goes, “Time in the market is more important than timing the market.”

Compounding is not just a financial thing. The most important returns in life come from the compounded effects of our investments over time, whether in our finances, careers, hobbies, or relationships.

Diversification. Never expose yourself to a fully catastrophic loss. Make sure you can walk away to fight another day. If you do it right, you only need to get rich once.

Diversification is the kevlar that protects you — with it, bad decisions will still hurt, but they won’t prove fatal. Diversification, in other words, is your bulletproof vest. […] That doesn’t mean I don’t look for opportunities that offer asymmetric upside — I do. I just don’t ever take off my kevlar. You don’t need to be a hero to get to economic security.

There is no simple step-by-step plan to become financially independent, otherwise everyone would be rich. Luck matters too, but working on all of these factors helps maintain maximum exposure to good luck.

My Money Blog has partnered with CardRatings and may receive a commission from card issuers. Some or all of the card offers that appear on this site are from advertisers and may impact how and where card products appear on the site. MyMoneyBlog.com does not include all card companies or all available card offers. All opinions expressed are the author’s alone, and has not been provided nor approved by any of the companies mentioned.

MyMoneyBlog.com is also a member of the Amazon Associate Program, and if you click through to Amazon and make a purchase, I may earn a small commission. Thank you for your support.


Vanguard – How The Boring, Long-Term Focused Part of America Invests

My Money Blog has partnered with CardRatings and may receive a commission from card issuers. Some or all of the card offers that appear on this site are from advertisers and may impact how and where card products appear on the site. MyMoneyBlog.com does not include all card companies or all available card offers. All opinions expressed are the author’s alone.

Vanguard recently released a report on “How America Invests”, based on the 5 million households with Vanguard retail accounts (taxable and IRAs, not 401ks). It looked at investor behavior from 2015 through 2019, along with the first quarter of 2020, when there was a sharp market decline due to the COVID-19 pandemic. There is a lot of information packed inside, but here are a few quick takeaways.

The average portfolio of a Vanguard household. The averages seem reasonable, but I was a bit surprised that 16% of households are 100% bonds. Even if I was extremely conservative, I would still own something like 20% stocks to hedge against the risk of inflation and rising rates.

The typical Vanguard household holds a long-term, risk-taking portfolio that’s both diversified and balanced. The average portfolio consists of 63% equities (stocks), 16% fixed income (bonds), and 21% cash (short-term reserves). However, there are substantial differences in risk-taking across investors, with equity risk ranging from conservative to aggressive for investors with otherwise similar asset levels or ages. At the extremes, 16% of households hold no equities, while 22% hold very risky portfolios containing at least 98% equities.

Self-directed investor glide path vs. what Vanguard thinks is best. It is interesting to see what people actually own when they are self-directed, as compared to what Vanguard recommends in their Target-date Retirement Fund and their Vanguard Personal Advisory Services (VPAS) that charges an 0.30% annual fee.

This chart compares the asset allocation (% in stocks) of self-directed investors (blue line is median) against that of Vanguard target-date funds (red line). We see that there is a lot of variation amongst self-directed investors, but overall they do decrease their exposure over time like nearly all target-date funds. However, they don’t decrease it nearly as much as Vanguard’s target-date funds past the age of 65. (Click to enlarge.)

This chart compares the asset allocation (% in stocks) of self-directed investors (dark beige is median) against that of those being advised by Vanguard Personal Advisory Services (light blue line is median). Here, the recommended median asset allocation is much closer to that of the self-directed median. Comparing with the chart above, we see a gap betwewn VPAS and their own Target Retirement funds. Why are their target-date funds so much more conservative? (Click to enlarge.)

Mutual funds are still the most popular, but ETFs are gaining. Only 13% of Vanguard households hold any ETFs at all as of 2019, but that number is double that of 2015.

Younger investors tend to own index funds, while older investors still hold a lot of actively-managed funds. This chart tracks the usage of index funds/actively-managed funds/cash vs. age. I’m actually a little surprised at how much actively-managed funds are held by the older cohorts. Contrast this with the fact that roughly 2/3rd of Vanguard’s global assets under management are in their index funds/ETFs. (Click to enlarge.)

Vanguard account owners are not active traders! Over 75% of Vanguard households place zero trades per year. The Vanguard stereotype would probably be the polar opposite of the Robinhood stereotype. (As someone with the majority of their assets at Vanguard and only a small percentage in trading apps, I’m quite fine with that!) Check out this quote (emphasis mine):

Fewer than one-quarter of Vanguard households trade in any given year, and those that do typically only trade twice. Most traders’ behavior is consistent with rebalancing or is professionally advised.

During the COVID-19 market volatility, Vanguard households stayed boring and long-term focused. The quote below essentially says “they did nothing different”.

Twenty-two percent of households traded in the first half of 2020—a rate typical of trading for a full calendar year. Despite the increase in trading, less than 1% of households abandoned equities completely during the downturn, while just over 1% traded to extremely aggressive portfolios. The net result of the portfolio and market changes was a modest reduction in the average household equity allocation, from 63% to 62%.

My Money Blog has partnered with CardRatings and may receive a commission from card issuers. Some or all of the card offers that appear on this site are from advertisers and may impact how and where card products appear on the site. MyMoneyBlog.com does not include all card companies or all available card offers. All opinions expressed are the author’s alone, and has not been provided nor approved by any of the companies mentioned.

MyMoneyBlog.com is also a member of the Amazon Associate Program, and if you click through to Amazon and make a purchase, I may earn a small commission. Thank you for your support.


My Money Blog Portfolio Income Update – February 2021

My Money Blog has partnered with CardRatings and may receive a commission from card issuers. Some or all of the card offers that appear on this site are from advertisers and may impact how and where card products appear on the site. MyMoneyBlog.com does not include all card companies or all available card offers. All opinions expressed are the author’s alone.

dividendmono225

While my February 2021 portfolio is designed for total return, I also track the income produced. Stock dividends are the portion of profits that businesses have decided they don’t need to reinvest into their business. The dividends may suffer some short-term drops, but over the long run they have grown faster than inflation. Interest from bonds and bank deposits are steadier, but these days it actually lags inflation a bit.

I track the “TTM” or “12-Month Yield” from Morningstar, which is the sum of the trailing 12 months of interest and dividend payments divided by the last month’s ending share price (NAV) plus any capital gains distributed over the same period. I prefer this measure because it is based on historical distributions and not a forecast. Below is a close approximation of my portfolio (2/3rd stocks and 1/3rd bonds).

Asset Class / Fund % of Portfolio Trailing 12-Month Yield (Taken 2/10/21) Yield Contribution
US Total Stock
Vanguard Total Stock Market Fund (VTI, VTSAX)
25% 1.43% 0.36%
US Small Value
Vanguard Small-Cap Value ETF (VBR)
5% 1.65% 0.08%
International Total Stock
Vanguard Total International Stock Market Fund (VXUS, VTIAX)
25% 2.13% 0.53%
Emerging Markets
Vanguard Emerging Markets ETF (VWO)
5% 1.85% 0.09%
US Real Estate
Vanguard REIT Index Fund (VNQ, VGSLX)
6% 3.92% 0.24%
Intermediate-Term High Quality Bonds
Vanguard Intermediate-Term Treasury ETF (VGIT)
17% 1.53% 0.26%
Inflation-Linked Treasury Bonds
Vanguard Short-Term Inflation-Protected Securities ETF (VTIP)
17% 1.19% 0.20%
Totals 100% 1.76%


Trailing 12-month yield history. Here is a chart showing how this 12-month trailing income rate has varied since I started tracking it in 2014.

Portfolio value reality check. One of the things I like about using this number is that when stock prices drop, this percentage metric usually goes up – which makes me feel better in a bear market. When stock prices go up, this percentage metric usually goes down, which keeps me from getting too euphoric during a bull market.

This quarter’s trailing income yield of 1.74% is the lowest ever since 2014. At the same time, my portfolio value is also bigger than ever. This just confirms that much of the recent US stock market price rise has been due to P/E ratio expansion, as opposed to higher earnings and profits. Either prices will drop quickly and then the future will look brighter, or prices won’t drop and the future will simply hold lower returns.

I choose to treat this income as a “no-stress, perpetual withdrawal rate”. There are countless articles debating this topic, but I support a 3% withdrawal rate as a reasonable target for planning purposes if you want to retire young (before age 50) and a 4% withdrawal rate as a reasonable target if retiring at a more traditional age (closer to 65). If you are not close to retirement, your time is better spent focusing on earning potential via better career moves, investing in your skillset, and/or looking for entrepreneurial opportunities where you own equity in a business asset.)

How we handle this income. Our dividends and interest income are not automatically reinvested. I treat this money as part of our “paycheck”. Then, as with a real paycheck, we can choose to either spend it or reinvest in more stocks and bonds.

Although we are not retired, this portfolio income does enable us to have more flexible working hours as parents of three young kids. If we’re being honest, I don’t think either of us truly wants to be a full-time stay-at-home parent while the other works for money full-time. Nor do we want to be the sole full-time worker while the other stays at home. This works best for us.

We are very thankful for this financial flexibility (always, but especially during this pandemic), which has been both a result of conscious preparation over 15+ years and good fortune. Others may use their portfolio income to pursue new interests, start a new business, sit on a beach, do charity or volunteer work, and so on.

My Money Blog has partnered with CardRatings and may receive a commission from card issuers. Some or all of the card offers that appear on this site are from advertisers and may impact how and where card products appear on the site. MyMoneyBlog.com does not include all card companies or all available card offers. All opinions expressed are the author’s alone, and has not been provided nor approved by any of the companies mentioned.

MyMoneyBlog.com is also a member of the Amazon Associate Program, and if you click through to Amazon and make a purchase, I may earn a small commission. Thank you for your support.


MMB Portfolio Asset Allocation Update, February 2021

My Money Blog has partnered with CardRatings and may receive a commission from card issuers. Some or all of the card offers that appear on this site are from advertisers and may impact how and where card products appear on the site. MyMoneyBlog.com does not include all card companies or all available card offers. All opinions expressed are the author’s alone.

portpie_blank200

A central idea here is skin in the game, showing what someone really does with their own money. Too often, what the “experts” tell you to do is quite different than what they own themselves. Here’s my current portfolio as of February 2021, including our 401k/403b/IRAs, taxable brokerage accounts, and savings bonds but excluding our house, cash reserves, and a few side investments. I use these updates to help determine where to invest new cash to rebalance back towards our target asset allocation.

Actual Asset Allocation and Holdings

I use both Personal Capital and a custom Google Spreadsheet to track my investment holdings. The Personal Capital financial tracking app (free, my review) automatically logs into my different accounts, adds up my various balances, tracks my performance, and calculates my overall asset allocation. Once a quarter, I also update my manual Google Spreadsheet (free, instructions) because it helps me calculate how much I need in each asset class to rebalance back towards my target asset allocation.

Here are some performance and asset allocation charts, per the “Allocation” and “Holdings” tabs of my Personal Capital account, respectively:

Stock Holdings
Vanguard Total Stock Market (VTI, VTSAX)
Vanguard Total International Stock Market (VXUS, VTIAX)
Vanguard Small Value (VBR)
Vanguard Emerging Markets (VWO)
Vanguard REIT Index (VNQ, VGSLX)

Bond Holdings
Vanguard Limited-Term Tax-Exempt (VMLTX, VMLUX)
Vanguard Intermediate-Term Tax-Exempt (VWITX, VWIUX)
Vanguard Intermediate-Term Treasury (VFITX, VFIUX)
Vanguard Inflation-Protected Securities (VIPSX, VAIPX)
Fidelity Inflation-Protected Bond Index (FIPDX)
iShares Barclays TIPS Bond (TIP)
Individual TIPS securities
U.S. Savings Bonds (Series I)

Target Asset Allocation. I do not spend a lot of time backtesting various model portfolios, as I don’t think picking through the details of the recent past will necessarily create superior future returns. I mainly make sure that I own asset classes that will provide long-term returns above inflation, distribute income via dividends and interest, and finally offer some historical tendencies to balance each other out. I make a small bet that US Small Value and Emerging Markets will have higher future long-term returns (along with some higher volatility) than the more large and broad indexes, although I could be wrong.

While you could argue for various other asset classes, I believe that it is important to imagine an asset class doing poorly for a long time, with bad news constantly surrounding it, and only hold the ones where you still think you can maintain faith through those fearful times. I simply don’t have strong faith in the long-term results of commodities, gold, or bitcoin. (In the interest of full disclosure, I do own tiny bits of gold and BTC, but at less than 1% of net worth.)

My US/international ratio floats with the total world market cap breakdown, currently at ~57% US and 43% ex-US. I think it’s okay to have a slight home bias (owning more US stocks than the overall world market cap), but I want to avoid having an international bias.

Stocks Breakdown

  • 43% US Total Market
  • 7% US Small-Cap Value
  • 33% International Total Market
  • 7% Emerging Markets
  • 10% US Real Estate (REIT)

Bonds Breakdown

  • 33% US Treasury Bonds, intermediate (or FDIC-insured)
  • 33% High-Quality Municipal Bonds (taxable)
  • 33% US Treasury Inflation-Protected Bonds (tax-deferred)

I have settled into a long-term target ratio of 67% stocks and 33% bonds (2:1 ratio) within our investment strategy of buy, hold, and occasionally rebalance. I will use the dividends and interest to rebalance whenever possible in order to avoid taxable gains. I plan to only manually rebalance past that if the stock/bond ratio is still off by more than 5% (i.e. less than 62% stocks, greater than 72% stocks). With a self-managed, simple portfolio of low-cost funds, we minimize management fees, commissions, and taxes.

Holdings commentary. I should be happy that my portfolio numbers seem to keep going up and up after the March 2020 scare, but instead I am mentally preparing myself for some low future returns over the next decade or so. I’m not making any big moves, but in keeping with my investment plan, I will be selling some US stocks this month as part of normal rebalancing. I remain optimistic that capitalism, human ingenuity, human resilience, and our system of laws will continue to improve things over time.

I’ve been seeing various articles about how to adjust your investing after the Gamestop short squeeze. Given that my holding strategy doesn’t require me to follow any market news at all, I don’t need to do any adjusting! 🙂

Performance numbers. According to Personal Capital, my portfolio ended up about 14% over all of 2020. An alternative benchmark for my portfolio is 50% Vanguard LifeStrategy Growth Fund and 50% Vanguard LifeStrategy Moderate Growth Fund – one is 60/40 and the other is 80/20 so it also works out to 70% stocks and 30% bonds. That benchmark would have a total return of +14.5% for 2020 YTD as of 11/3/2020.

The goal of this portfolio is to create sustainable income that keeps up with inflation to cover our household expenses. I’ll share about more about the income aspect in a separate post.

My Money Blog has partnered with CardRatings and may receive a commission from card issuers. Some or all of the card offers that appear on this site are from advertisers and may impact how and where card products appear on the site. MyMoneyBlog.com does not include all card companies or all available card offers. All opinions expressed are the author’s alone, and has not been provided nor approved by any of the companies mentioned.

MyMoneyBlog.com is also a member of the Amazon Associate Program, and if you click through to Amazon and make a purchase, I may earn a small commission. Thank you for your support.


What If You Invested $10,000 Every Year For the Last 10 Years? 2021 Edition

My Money Blog has partnered with CardRatings and may receive a commission from card issuers. Some or all of the card offers that appear on this site are from advertisers and may impact how and where card products appear on the site. MyMoneyBlog.com does not include all card companies or all available card offers. All opinions expressed are the author’s alone.

Instead of focusing only on what happened in 2020, how about stepping back and taking the longer view? How would a slow-and-steady investor have done over the last decade? Most successful savers invest money each year over a long period of time, these days often into a target-date fund (TDF). You may not find yourself buying Bugattis with Bitcoin, but we should not take for granted the ability for everyday folks to own a basket of successful businesses for tiny fees. Don’t pass up the opportunity right in front of you.

Target date funds. The Vanguard Target Retirement 2045 Fund is an all-in-one fund that is low-cost, highly diversified, and available both inside many employer retirement plans and to anyone that funds an IRA. During the early accumulation phase, this fund holds 90% stocks (both US and international) and 10% bonds (investment-grade domestic and international). It is a solid default choice in a world of mediocre, overpriced options. These “simple” funds have made substantial wealth for millions of investors.

The power of consistent, tax-advantaged investing. For the last decade, the maximum allowable annual contribution to a Traditional or Roth IRA has been roughly $5,000 per person. The maximum allowable annual contribution for a 401k, 403b, or TSP plan has been over $10,000 per person. If you have a household income of $67,000, then $10,000 is right at the 15% savings rate mark. Therefore, I’m going to use $10,000 as a benchmark amount. This round number also makes it easy to multiply the results as needed to match your own situation. Save $5,000 a year? Halve the result. Save $20,000 a year? Double the numbers, and so on.

The real-world payoff from a decade of saving $833 a month. What would have happened if you put $10,000 a year into the Vanguard Target Retirement 2045 Fund, every year, for the past 10 years? You’d have put in $100,000 over time, but in more manageable increments. With the interactive tools at Morningstar and a Google spreadsheet, we get this:

Investing $10,000 every year for the last decade would have resulted in a total balance of $184,000. That breaks down to $100k in contributions + $84k investment growth.

Extended edition: 15 years of real-world savings. What would have happened if you put $10,000 a year into the Vanguard Target Retirement 2045 Fund, every year, for the past 15 years instead? (Now $150,000 total.) Here are the extended return numbers:

Investing $10,000 every year for the last decade and a half would have resulted in a total balance of $324,000. That breaks down to $150k in contributions + $175k investment growth. Your gains are now officially more than what you initially invested.

Real-world path to becoming a 401(k) millionaire. Not theoretical numbers from a calculator! Are you a dual-income household that can put away more? If you were a couple that both maxed out their 401k and IRAs at roughly $20k each or $40k total per year for 10 years, you would have a total balance of over $735,000. You would be 3/4 of the way to millionaire status after a decade. That breaks down to $400k in contributions + $335k investment growth.

If you did this for the last 15 years, you would be a 401(k) millionaire household. If you started when you were 30 years old, your account statement would show a balance just shy of $1,300,000 by the age of 45. (This doesn’t include the 401k company match, which is how many people reach millionaire status even faster.)

Timing still matters, but not as much as you might think due to the dollar-cost averaging and longer time horizon. Yes, the last decade has been a great run for US stock markets. But Vanguard Target funds also own a lot of international stocks, which haven’t been nearly as hot and have maintained lower valuations. More importantly, you can’t control that part. You have much more control over how much you save. Here are my previous “saving for a decade” posts:

Work on improving your career skills (or start your own business), save a big chunk of your income, and then invest it in productive assets. Keep calm and repeat. The only “secret” here is consistency. We have maxed out both IRA and the 401k salary deferral limits nearly every year since 2004. No inheritances, no special access to a hedge fund, no stock-picking skill. You can build serious wealth with something as accessible and boring as the Vanguard Target Retirement fund.

My Money Blog has partnered with CardRatings and may receive a commission from card issuers. Some or all of the card offers that appear on this site are from advertisers and may impact how and where card products appear on the site. MyMoneyBlog.com does not include all card companies or all available card offers. All opinions expressed are the author’s alone, and has not been provided nor approved by any of the companies mentioned.

MyMoneyBlog.com is also a member of the Amazon Associate Program, and if you click through to Amazon and make a purchase, I may earn a small commission. Thank you for your support.