Every asset class has its energetic supporters, from rental properties to altcoins to gold. Listening to each group, you may feel that you need to own every asset class in order to be “diversified”. However, sometimes less is more, and it can be useful to read about why many seasoned veterans consciously avoid certain corners of the investment world. I find it a refreshingly different perspective, even if I may or may not agree. Everyone’s needs are different, and I own several of the things below myself. Here are a few lists along with supporting arguments.
William Bernstein – MD, author and wealth manager. I compiled this list while listening to the linked interview.
- Commodities Futures
- Individual Stocks
- Corporate bonds
- Long-term bonds
- Fixed annuities
Jonathan Clements – financial author and long-time WSJ columnist
- Savings bonds.
- Long-term bonds.
- High-yield “junk” bonds.
- Municipal bonds.
- International bonds.
- Individual stocks.
- Immediate fixed annuities (but he does plan to buy some eventually).
- Deferred income annuities.
- Gold
- Commodities
- Real Estate Investment Trusts (REITs)
- Rental properties.
- Long-term-care insurance.
- Life insurance.
- Disability insurance.
- Flood insurance.
Amy Arnott – CFA, portfolio strategist for Morningstar Research
- Actively Managed Funds
- Real Estate Investment Trusts (REITs)
- Sector Funds
- Alternative Investments
- I Bonds
- High-Yield Bonds
- Gold
Let me know if you come across any other “What I Don’t Own” lists.
[Image credit: Amazon]
 In a recent
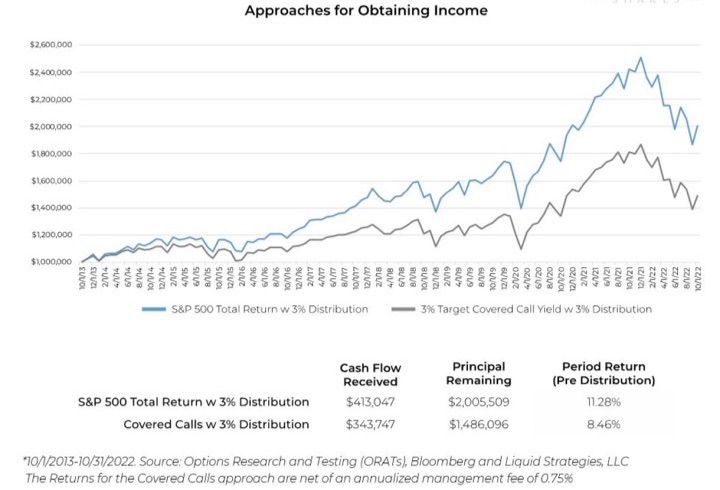
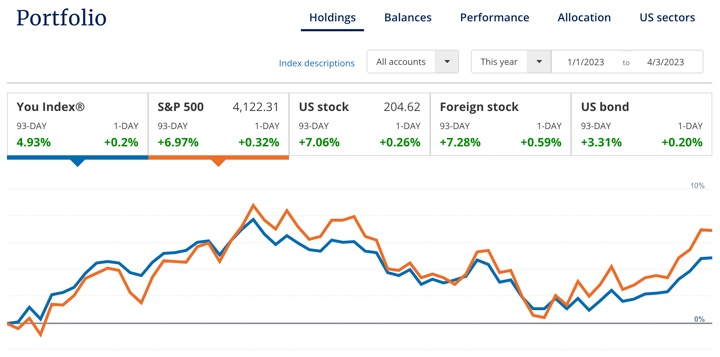
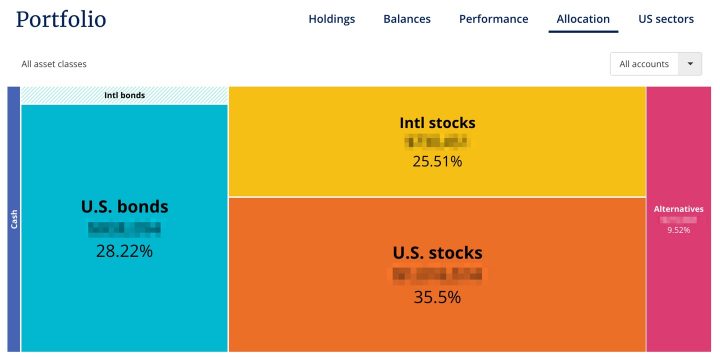
 Here’s my 2023 Q2 income update for my
 One of the concerns about contributing to 529 plan for college savings is that you won’t end up using all the money and end up being hit with additional taxes (at ordinary income rates) and penalties on an non-qualified withdrawal. The funds potentially would have been better off simply invested in a taxable brokerage account (and long-term capital gains rates).
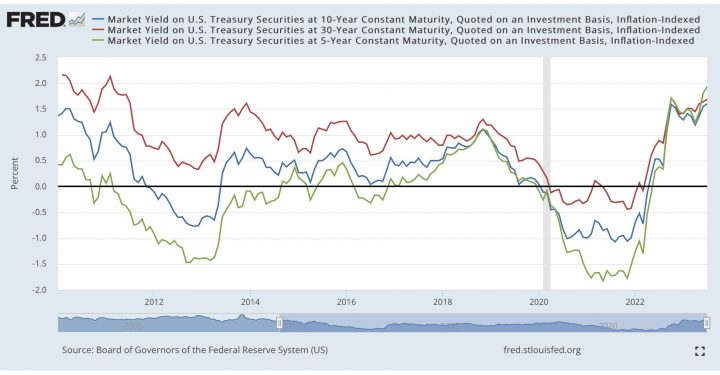
  Savings I Bonds are a unique, low-risk investment backed by the US Treasury that pay out a variable interest rate linked to inflation. With a holding period from 12 months to 30 years, you could own them as an alternative to bank certificates of deposit (they are liquid after 12 months) or bonds in your portfolio.
 The Best Credit Card Bonus Offers – 2025
 Big List of Free Stocks from Brokerage Apps
 Best Interest Rates on Cash - 2025
 Free Credit Scores x 3 + Free Credit Monitoring
 Best No Fee 0% APR Balance Transfer Offers
 Little-Known Cellular Data Plans That Can Save Big Money
 How To Haggle Your Cable or Direct TV Bill
 Big List of Free Consumer Data Reports (Credit, Rent, Work)