Reader Question: Buying Individual Corporate Bonds on Secondary Market At 6% APY?

My Money Blog has partnered with CardRatings and may receive a commission from card issuers. Some or all of the card offers that appear on this site are from advertisers and may impact how and where card products appear on the site. MyMoneyBlog.com does not include all card companies or all available card offers. All opinions expressed are the author’s alone.

Here’s a good question from reader Elizabeth in response to yesterday’s post about buying Treasury bonds on the open secondary market:

One thing I’m interested in is on that same table you shared – Corporate bonds rated BBB are around 6% for 5 years. Can you write about this? What are the pros and cons?

Here’s my thought process. Yes, us “retail” investors can also buy individual corporate bonds via major brokers with a fixed income desk like Fidelity. (Bond trading is rare on newer trading apps like Robinhood.) The bonds are judged by various rating agencies and usually separated by their grading. Right now, I see a Moody’s BAA3-rated corporate bond with 5 years left until maturity paying 6.78% interest (click to enlarge):

However, corporate bonds are not within my circle of knowledge. The special thing about every single US Treasury bond is that they are all fully-backed by the US government. Same with an FDIC-insured bank CD or NCUA-insured credit union certificate. It’s like comparing all 16 oz. jars of JIF brand peanut butter; I know all of them are the same, so I can just buy on price.

Once you venture into the world of corporate bonds, things get a lot more complicated. There is wide range of potential credit risk from the issuing company. If the company fails, you may not receive your initial principal back. There is call risk from callable bonds where the issuer can redeem your bond early (to their benefit), not to mention several other early redemption wrinkles like “make whole call”, “sinking fund protection”, and “special optional redemptions”.

Baa3 and BBB- rated bonds are still technically “investment-grade”, but they are just one notch above “below investment-grade”, aka “junk”, aka “high-yield” bonds. Here is a quick table of bond ratings from Investopedia:

If take a closer look at the available bonds above, you’ll see that only one bond is paying over 6.7% and it doesn’t even have an S&P rating, which means there might be something funny going on. The rates quickly go back down to the 5.XX% range.

Do I know why one bond has to pay 6.7% interest rate to entice a buyer, while another one only has to offer 4.8%? I must admit that I really have no idea.

Bonds are for safety. In addition, I should remember my reason for holding bonds. They are my safety blanket. They are my next 10 years of expenses that are guaranteed to be there even if bad things happens. What if Russia bombed a NATO country tomorrow? The US would be obligated to go to war. China might then feel that it has to back Russia. Who knows. Hope for the best. Prepare for the worst.

My goal with bonds is to maximize yield without sacrificing safety.

Stocks are for growth and upside potential. Let’s take the bottom bond highlighted – an Ally Financial corporate bond paying 5.6% yield for the next 5 years. Ally Bank is familiar to me, and I am a longtime customer. Why not buy that bond? Well, if I bought that bond, the most that it will ever pay me back is the bond face value and interest. Worst case is still that Ally goes bankrupt and I lose all or most of my entire investment and end up with zero. This has happened, and to much larger companies than Ally.

Up to 6 days before their eventual collapse, Lehman Brothers had an A investment grade rating. The eventual recovery on their bonds was 21 cents on the dollar.

However, I could also buy Ally Financial stock (ticker ALLY). Right now, it is trading at only a 4.72 P/E ratio and is even paying a dividend yield of 3.54%. Five years from now, I could be sitting on a +50% or +100% or +200% total return. In other words, if you want to take on risk for a higher return, you are competing with stocks. There is ongoing debate about the inclusion of high-yield bonds in a portfolio, but I prefer to take risks with stocks and keep my bonds as safe as possible.

Consider a low-cost, diversified mutual fund or ETF. The benefit of holding riskier corporate bonds inside a mutual fund/ETF is that any one corporate bankruptcy won’t wipe you out. You can be diversified across hundreds of companies. Now, you can’t control the maturity as tightly, you’ll still lose some yield to management costs, and you’re still subject to interest rate risk. If you own the Vanguard Total Bond Market ETF (BND) or any Vanguard Target Retirement Fund, you already own corporate bonds inside a fund.

If I had to buy corporate bonds and wanted a stream of higher income without a reckless amount of credit risk, I would consider the Vanguard High-Yield Corporate Fund Investor Shares (VWEHX, $3k min) or Vanguard High-Yield Corporate Fund Admiral Shares (VWEAX, $50k min). VWEHX has a 0.23% expense ratio and a 30-day SEC yield of 6.71% as of 07/18/2022. VWEAX has a 0.13% expense ratio and a 30-day SEC yield of 6.81% as of 07/18/2022.

You are buying a basket of nearly 700 bonds that straddle the line between investment-grade and below investment-grade. This is a bond fund that I would own for the income stream, not if I needed the entire amount in cash soon as it can drop quite a lot during times of market stress. The expense ratio on this Vanguard fund is much lower than the industry average. Just a suggestion for further research. I don’t own this fund. In fact, I don’t own any corporate bonds at all.

Hope that helps!

My Money Blog has partnered with CardRatings and may receive a commission from card issuers. Some or all of the card offers that appear on this site are from advertisers and may impact how and where card products appear on the site. MyMoneyBlog.com does not include all card companies or all available card offers. All opinions expressed are the author’s alone, and has not been provided nor approved by any of the companies mentioned.

MyMoneyBlog.com is also a member of the Amazon Associate Program, and if you click through to Amazon and make a purchase, I may earn a small commission. Thank you for your support.


MMB Portfolio 2022 2nd Quarter Update: Dividend & Interest Income

My Money Blog has partnered with CardRatings and may receive a commission from card issuers. Some or all of the card offers that appear on this site are from advertisers and may impact how and where card products appear on the site. MyMoneyBlog.com does not include all card companies or all available card offers. All opinions expressed are the author’s alone.

via GIPHY

Here’s my quarterly update on the income produced by my Humble Portfolio (2022 Q2). I track the income produced as an alternative metric for performance. The total income goes up much more gradually and consistently than the number shown on brokerage statements (price), which helps encourage consistent investing. I imagine them as building up a factory that churns out dollar bills. You can still track your dividend and interest income with a total return portfolio. You don’t need a bunch of high-yield stocks, MLPs, leveraged REITs, or covered call ETFs.

Background: Overall stock market dividend growth. Stock dividends are a portion of net profits that businesses have decided to distribute directly to shareholders, as opposed to reinvesting into their business, paying back debt, or buying back shares directly. The dividends may suffer some short-term drops, but over the long run they have grown faster than inflation.

In the US, the dividend culture is somewhat conservative in that shareholders expect dividends to be stable and only go up. Dividend cuts tend to be avoided. Thus the starting yield is lower, but it can grow faster. Here is the historical growth of the trailing 12-month (ttm) dividend paid by the Vanguard Total US Stock ETF (VTI), courtesy of StockAnalysis.com. Currently, 31% of VTI’s net earnings are sent to you as a dividend. Notice how it grows gradually, with the current annual dividend 76% higher than in September 2013:

European corporate culture tends to encourage paying out a higher (sometimes fixed) percentage of earnings as dividends, but that means the dividends move up and down with earnings. Thus the starting yield is higher but may not grow as fast. Here is the historical growth of the trailing 12-month (ttm) dividend paid by the Vanguard Total International Stock ETF (VXUS). Currently, 47% of VXUS’s net earnings are sent to you as a dividend. Notice how it stays more stable (but also dropped during 2020 due to COVID), with the current annual dividend only 25% higher than in September 2013:

The dividend yield (dividends divided by price) also serve as a rough valuation metric. When stock prices drop, this percentage metric usually goes up – which makes me feel better in a bear market. When stock prices go up, this percentage metric usually goes down, which keeps me from getting too euphoric during a bull market. Here’s a related quote from Jack Bogle (source):

The true investor will do better if he forgets about the stock market and pays attention to his dividend returns and to the operating results of his companies.

My personal portfolio income history. I started tracking the income from my portfolio in 2014. Here’s what the annual distributions from my portfolio look like over time:

  • $1,000,000 invested in my portfolio as of January 2014 would have generated about $24,000 in annual income over the previous 12 months. (2.4% starting yield)
  • If I reinvested the income but added no other contributions, today in 2022 it would have generated ~$48,000 in annual income over the previous 12 months.

This chart shows how the annual income generated by my portfolio has changed.

TTM income yield. To estimate the income from my portfolio, I use the weighted “TTM” or “12-Month Yield” from Morningstar, which is the sum of the trailing 12 months of interest and dividend payments divided by the last month’s ending share price (NAV) plus any capital gains distributed (usually zero for index funds) over the same period. The trailing income yield for this quarter was 2.99%, as calculated below. Then I multiply by the current balance from my brokerage statements to get the total income.

Asset Class / Fund % of Portfolio Trailing 12-Month Yield Yield Contribution
US Total Stock (VTI) 25% 1.61% 0.40%
US Small Value (VBR) 5% 2.12% 0.11%
Int’l Total Stock (VXUS) 25% 3.87% 0.97%
Emerging Markets (VWO) 5% 3.35% 0.17%
US Real Estate (VNQ) 6% 3.14% 0.19%
Inter-Term US Treasury Bonds (VGIT) 17% 1.25% 0.21%
Inflation-Linked Treasury Bonds (VTIP) 17% 5.59% 0.95%
Totals 100% 2.99%


Commentary. My ttm yield is now ~3%. Both US and international stock prices have gone down, and my ttm dividend yield has gone up. The price of my Treasury bonds have also gone down as nominal rates have gone up, but the yield will eventually go up as the money is reinvested into new bonds at higher rates. My TIPS yield has gone up significantly as CPI inflation has spiked. Of course, the NAV on my TIPS has also gone down, as real yields have gone up (again will be better as money is reinvested). TIPS are a bit complicated like that.

Use as a retirement planning metric. As a very rough goal, I support the simple 4% or 3% rule of thumb, which equates to a target of accumulating roughly 25 to 33 times your annual expenses. I would lean towards a 3% withdrawal rate if you want to retire young (before age 50) and a 4% withdrawal rate if retiring at a more traditional age (closer to 65). It’s just a target, not a number sent down from a higher being. During the accumulation stage, your time is better spent focusing on earning potential via better career moves, improving in your skillset, and/or looking for entrepreneurial opportunities where you can have an ownership interest.

Even if do you reach that 25X or 30X goal, it’s just a moment in time. The market can shift, your expenses can shift, and so I find that tracking income makes more tangible sense in my mind and is more useful for those who aren’t looking for a traditional retirement. Our dividends and interest income are not automatically reinvested. They are another “paycheck”. Then, as with a traditional paycheck, we can choose to either spend it or invest it again to compound things more quickly. Even if we spend the dividends, this portfolio paycheck will still grow over time. You could use this money to cut back working hours, pursue a different career path, start a new business, take a sabbatical, perform charity or volunteer work, and so on. This is your one life and it only lasts about 4,000 weeks.

My Money Blog has partnered with CardRatings and may receive a commission from card issuers. Some or all of the card offers that appear on this site are from advertisers and may impact how and where card products appear on the site. MyMoneyBlog.com does not include all card companies or all available card offers. All opinions expressed are the author’s alone, and has not been provided nor approved by any of the companies mentioned.

MyMoneyBlog.com is also a member of the Amazon Associate Program, and if you click through to Amazon and make a purchase, I may earn a small commission. Thank you for your support.


MMB Humble Portfolio 2022 2nd Quarter Update: Asset Allocation & Performance

My Money Blog has partnered with CardRatings and may receive a commission from card issuers. Some or all of the card offers that appear on this site are from advertisers and may impact how and where card products appear on the site. MyMoneyBlog.com does not include all card companies or all available card offers. All opinions expressed are the author’s alone.

portpie_blank200Here’s my quarterly update on my current investment holdings as of 7/8/22, including our 401k/403b/IRAs and taxable brokerage accounts but excluding real estate and side portfolio of self-directed investments. Following the concept of skin in the game, the following is not a recommendation, but just to share an real, imperfect, low-cost, diversified DIY portfolio. The goal of this “Humble Portfolio” is to create sustainable income that keeps up with inflation to cover our household expenses.

“Never ask anyone for their opinion, forecast, or recommendation. Just ask them what they have in their portfolio.” – Nassim Taleb

TL;DR changes: Went from 67/33 stocks/bonds ratio to 64/36, so buying more US and International Stocks with available cashflow.

How I Track My Portfolio
I’m often asked how I track my portfolio across multiple brokers and account types. (Morningstar also recently discontinued free access to their portfolio tracker.) I use both Personal Capital and a custom Google Spreadsheet to track my investment holdings:

  • The Personal Capital financial tracking app (free, my review) automatically logs into my different accounts, adds up my various balances, tracks my performance, and calculates my overall asset allocation daily.
  • Once a quarter, I also update my manual Google Spreadsheet (free, instructions) because it helps me calculate how much I need in each asset class to rebalance back towards my target asset allocation. I also create a new tab each quarter, so I have snapshot of my holdings dating back many years.

July 2022 Asset Allocation and YTD Performance
Here are updated performance and asset allocation charts, per the “Allocation” and “Holdings” tabs of my Personal Capital account.

Target Asset Allocation. I call this my “Humble Portfolio” because it accepts the repeated findings that individuals cannot reliably time the market, and that persistence in above-average stock-picking and/or sector-picking is exceedingly rare. Costs matter and nearly everyone who sells outperformance, for some reason keeps charging even if they provide zero outperformance! By paying minimal costs including management fees and tax drag, you can actually guarantee yourself above-average net performance over time.

I own broad, low-cost exposure to productive assets that will provide long-term returns above inflation, distribute income via dividends and interest, and finally offer some historical tendencies to balance each other out. I have faith in the long-term benefit of owning publicly-traded US and international shares of businesses, as well as the stability of high-quality US Treasury and municipal debt. My stock holdings roughly follow the total world market cap breakdown at roughly 60% US and 40% ex-US. I add some “spice” to the vanilla funds with the inclusion of “small value” ETFs for US, Developed International, and Emerging Markets stocks as well as additional real estate exposure through US REITs.

I strongly believe in the importance of knowing WHY you own something. Every asset class will eventually have a low period, and you must have strong faith during these periods to truly make your money. You have to keep owning and buying more stocks through the stock market crashes. You have to maintain and even buy more rental properties during a housing crunch, etc. A good sign is that if prices drop, you’ll want to buy more of that asset instead of less. I don’t have strong faith in the long-term results of commodities, gold, or bitcoin – so I don’t own them.

I do not spend a lot of time backtesting various model portfolios, as I don’t think picking through the details of the recent past will necessarily create superior future returns. Usually, whatever model portfolio is popular in the moment just happens to hold the asset class that has been the hottest recently as well.

Find productive assets that you believe in and understand, and just keep buying them through the ups and downs. Mine may be different than yours.

I have settled into a long-term target ratio of roughly 70% stocks and 30% bonds (or 2:1 ratio) within our investment strategy of buy, hold, and occasionally rebalance. This is more conservative than most people my age, but I am settling into a more “perpetual income portfolio” as opposed to the more common “build up a big stash and hope it lasts until I die” portfolio. My target withdrawal rate is 3% or less. Here is a round-number breakdown of my target portfolio.

  • 30% US Total Market
  • 5% US Small-Cap Value
  • 20% International Total Market
  • 5% International Small-Cap Value
  • 10% US Real Estate (REIT)
  • 20% High-Quality bonds, Municipal, US Treasury or FDIC-insured deposits
  • 10% US Treasury Inflation-Protected Bonds (or I Savings Bonds)

Commentary. According to Personal Capital, my portfolio down about 16% for 2022 YTD. My US and International stocks have dropped enough that all new cashflow is being placed into buying more of those asset classes. Simple as that. Keep on truckin’.

Since that was so short and boring, here a quick fact that I keep in my head. Using the “Rule of 72”, we know that if your portfolio returns 7% a year, it will double roughly every 10 years. $10,000 invested for 10 years will double to $20,000. However, $10,000 invested for 20 years will quadruple into $40,000. $10,000 invested for 30 years will octuple into $80,000. That provides a sense of the power of compounding and how it starts slow but kicks into turbo mode later on. I’ve been investing for about 20 years, so I’m getting to the good part! 😉

I’ll share about more about the income aspect in a separate post.

My Money Blog has partnered with CardRatings and may receive a commission from card issuers. Some or all of the card offers that appear on this site are from advertisers and may impact how and where card products appear on the site. MyMoneyBlog.com does not include all card companies or all available card offers. All opinions expressed are the author’s alone, and has not been provided nor approved by any of the companies mentioned.

MyMoneyBlog.com is also a member of the Amazon Associate Program, and if you click through to Amazon and make a purchase, I may earn a small commission. Thank you for your support.


Fidelity Solo FidFolios: DIY Custom Direct Indexing (Similar to M1 Finance)

My Money Blog has partnered with CardRatings and may receive a commission from card issuers. Some or all of the card offers that appear on this site are from advertisers and may impact how and where card products appear on the site. MyMoneyBlog.com does not include all card companies or all available card offers. All opinions expressed are the author’s alone.

Fidelity just announced a new feature called Fidelity Solo FidFolios. You can make a custom index with up to 50 individual stocks, or a custom asset allocation portfolio using ETFs. You can then buy into your custom portfolio all a once using flat dollar amounts and Fidelity will juggle the fractional shares. For example, your $50 purchase could be split into 50 different individual companies.

“Now more than ever, investors want the peace of mind of trading, monitoring, and rebalancing custom stock portfolios in a simple way,” said Robert Mascialino, head of Fidelity’s retail brokerage business. “With the ability to align to a specific theme or individual values, Fidelity Solo FidFoliosSM helps leverage the power of direct indexing to build a customized portfolio while simplifying how investors manage what they own.”

Costs. Flat $4.99 per month, with a 90-day free trial. No stock commissions. Works within your usual Fidelity brokerage or IRA account. If you stop paying the fee, you just end up holding those individuals stocks and/or ETFs.

Note that this is different from their Fidelity Managed FidFolios, which is professionally managed by Fidelity and more about using tax-loss harvesting to gain a slight after-tax advantage. The cost for Managed Fidfolios is 0.40% annual management fee with a $5,000 initial minimum.

This may sound familiar, as it is pretty much what the start-up M1 Finance first introduced years ago, with the important distinction that M1 Finance is free (so far). Motif Investing also ran something similar before they shut down and their technology was acquired by Schwab.

I believe that a “custom robo-advisor” feature is going to be widespread in the future. Many DIY folks would like the ability to make your own customized all-in-one Target Retirement Fund. It’s really not that technically difficult to allow everyone to create their own custom glide path. I explored this with a small investment in M1, but in practice I have found it trickier to implement if you have to rebalance across various 401k plans, IRAs, and taxable brokerage accounts. Still, I’d rather use M1 Finance or this Solo Fidfolio over another robo-advisor that changes their model portfolios every few years to match up with whatever is currently trendy.

My Money Blog has partnered with CardRatings and may receive a commission from card issuers. Some or all of the card offers that appear on this site are from advertisers and may impact how and where card products appear on the site. MyMoneyBlog.com does not include all card companies or all available card offers. All opinions expressed are the author’s alone, and has not been provided nor approved by any of the companies mentioned.

MyMoneyBlog.com is also a member of the Amazon Associate Program, and if you click through to Amazon and make a purchase, I may earn a small commission. Thank you for your support.


Schwab Hidden Fees: $187 Million Penalty For Intelligent Portfolios Robo-Advisor

My Money Blog has partnered with CardRatings and may receive a commission from card issuers. Some or all of the card offers that appear on this site are from advertisers and may impact how and where card products appear on the site. MyMoneyBlog.com does not include all card companies or all available card offers. All opinions expressed are the author’s alone.

via GIPHY

Schwab has agreed to pay a $187 million SEC settlement due to being sneaky about the fees charged by their robo-advisor product, Schwab Intelligent Portfolios (SIP). Schwab used “free” but quietly forced its own customers to hold a lot of cash in an high-cost form where they can skim off fees (and you get paid less interest). It was a relatively open secret in the financial planning industry, as noted in my own Intelligent Portfolios review:

Schwab makes a ton of money on your idle cash, and it is NOT an accident that they force you to own cash in their automated portfolios.

However, the details of this SEC settlement show that their behavior was even worse than I initially thought. As explained by Matt Levine in Money Stuff, Schwab literally decided how much profit they wanted first, and then worked their model asset allocations around that number. The technical version:

Each of SIP’s model portfolios held between 6% and 29.4% of clients’ assets in cash. The amount of cash that each SIP model portfolio contained was pre-set so that Respondents’ affiliate bank would earn at least a minimum amount of revenue from the spread on the cash by loaning out the money. …

In order to offer SIP without charging an advisory fee, Schwab management decided that the SIP portfolios would collectively hold an average of at least 12.5% of their assets in cash. To meet that goal, management set the exact amount of cash in each of SIP’s model portfolios, with the most aggressive portfolio containing 6% cash and the most conservative portfolio 29.4%, based in large part on its analysis that Schwab Bank would make a minimum amount of revenue at these levels. Management then provided these pre-set cash allocations to CSIA. In building the SIP model portfolios, CSIA treated the cash allocations provided by management as constraints and did not alter or adjust the cash allocations in any way. …

On February 18, 2015, weeks before the SIP launch, two articles were published in the media that were critical of SIP, claiming that the drag from the high cash allocations was a hidden cost of the program. In reaction to these articles, Schwab management directed that the SWIA ADV brochure be re-written, and that a public relations campaign be launched to explain the SIP cash allocations. …

While the ADV brochures disclosed that Schwab Bank earned income from the cash allocation for each investment strategy, SWIA’s and CSIA’s ADV brochures stated that the cash allocations in the SIP portfolios were “set based on a disciplined portfolio construction methodology designed to balance performance with risk management appropriate for a client’s goal, investing time frame, and personal risk tolerance, just as with other Schwab managed products.” This was false and misleading because the cash allocations were actually pre-set in order to reach minimum revenue targets for the Respondents.

Here it is more accurately summarized in this Reuters quote:

“Schwab claimed that the amount of cash in its robo-adviser portfolios was decided by sophisticated economic algorithms meant to optimize its clients’ returns when in reality it was decided by how much money the company wanted to make,” SEC enforcement chief Gurbir Grewal said.

Here’s what Schwab says in their press release:

We are proud to have built a product that allows investors to elect not to pay an advisory fee in return for allowing us to hold a portion of the proceeds in cash, and we do not hide the fact that our firm generates revenue for the services we provide.

Really, you don’t hide the fact? Let’s look at your product page now as of 6/15/2022. This is what you see without clicking further:

We believe cash is a key component of an investment portfolio. Based on your risk profile, a portion of your portfolio is placed in an FDIC-insured deposit at Schwab Bank. Some cash alternatives outside of the program pay a higher yield.

What else is not mentioned on their product page? The actual interest rate paid. The APY is not mentioned anywhere on that page, even through a link or fine print. You must go searching for this link, where you will find that SIP actually holds special “Sweep Shares” of the Schwab Government Money Fund (SWGXX) with a annual expense ratio of 0.44% and SEC yield of 0.38% as of 6/15/22. In comparison, Vanguard’s default cash sweep is the Vanguard Federal Money Market Fund (VMFXX) with a net expense ratio of 0.11% and SEC yield of 0.76% as of 6/15/22.

If you click further, you find their new fine print:

Assume a $100,000 account with a 10% Cash Allocation ($10,000), which would be a moderate—aggressive investment portfolio allocation. Using market interest rates from the first quarter of 2022, Schwab Bank earned about 1.03% on an annual basis on the cash it invested net of what it paid to clients in the Program. Schwab Bank would have received about $103 ($10,000 x 1.03%) on that cash deposit, annualized, which equates to 0.103% or 10.3 basis points ($103/$100,000) of the total client investment of $100,000.

However, the true cost to investors is not just the fees that Scwhab gets. Cash is not necessarily ideal for long-term portfolios. By dictating cash, you ignore other higher-yielding and arguably more appropriate options like their own Schwab Short-Term U.S. Treasury ETF (SCHO, 0.04% ER, 2.60% SEC yield) and Schwab Short-Term Bond Index Fund (SWSBX, 0.06% ER, 2.98% SEC yield).

Schwab customers are at this very moment, losing significant money from their high-cost cash drag instead of a low-cost, high-quality money market and/or short-term bond fund. Schwab customers should note that this quiet profit via cash holding motive runs throughout the company. The Schwab Bank “High Yield” Investor Savings account pays 0.05% APY. Uninvested bank sweep cash in your Schwab brokerage and retirement accounts pays a measly 0.01% APY.

I would bet that if you did a poll of all Schwab IP customers and asked them about it, a majority would have no idea about this arrangement.

Bottom line. After reading the details of this SEC settlement, the fact that Schwab put profit first and the actual design of the product second is the most offensive. I’d much rather you sell me a great product at a fair price. Schwab’s reputation is now lower in my mind. They have some good products, but I would not recommend Schwab Intelligent Portfolios (or any Schwab managed product based on their behavior here) for my family or friends.

My Money Blog has partnered with CardRatings and may receive a commission from card issuers. Some or all of the card offers that appear on this site are from advertisers and may impact how and where card products appear on the site. MyMoneyBlog.com does not include all card companies or all available card offers. All opinions expressed are the author’s alone, and has not been provided nor approved by any of the companies mentioned.

MyMoneyBlog.com is also a member of the Amazon Associate Program, and if you click through to Amazon and make a purchase, I may earn a small commission. Thank you for your support.


Chart: Every S&P 500 Bear and Bull Market in History

My Money Blog has partnered with CardRatings and may receive a commission from card issuers. Some or all of the card offers that appear on this site are from advertisers and may impact how and where card products appear on the site. MyMoneyBlog.com does not include all card companies or all available card offers. All opinions expressed are the author’s alone.

Even though I don’t check my retirement account balances daily (or weekly, or often monthly) it can still be nearly impossible to tune out all the market noise. I was promptly notified via e-mail press release that the S&P 500 index officially reached “Bear Market” status today 6/13/2022. A bear market is defined as a 20% drop from previous high, ending when the index reaches a low and subsequently rises by 20%.

The email also included this handy list of every bear market in the history of the S&P 500 index (since 1928). Credit to S&P Dow Jones Indices:

Takeaway: You should always be prepared for a drop of 50% in your stock holdings. Enduring such uncomfortable volatility is the price of investing in stocks, and if you don’t pay it, you don’t get the full returns.

I’ve yet to find anyone with a clear way to avoid these swings. Beyond buy-and-hold, perhaps the only thing is to wait only for the “fat pitches”, which are rare and far between. Even then, will you have the guts to swing? This is why I think of my primary portfolio as the “Humble Portfolio”.

Here is list of every bull market in history. A bull market is defined as 20% rise from the previous low, ending when the index reaches a high and subsequently drops by 20%.

Takeaway: The bull markets more than make up for the bear markets over the long run. At some point, you will be reminded that in order to make up for a 50% drop, stocks would have to go up by 100% just to break even again. That’s sounds like a lot, but in fact that has happened repeatedly and then some. You can see in the chart that this most recent bull market was a +400% change, and that doesn’t even include dividends.

Every one needs to find a good balance through education and experience where they can hold the risky stuff through the bad times, while also be happy holding the boring stuff through the “but my neighbor got rich daytrading crpyto” times. We are currently going through another period of heightened uncertainty. How do you feel about your portfolio today?

“History doesn’t repeat itself but it often rhymes.” – attributed to Mark Twain

Photo credit: Unsplash

My Money Blog has partnered with CardRatings and may receive a commission from card issuers. Some or all of the card offers that appear on this site are from advertisers and may impact how and where card products appear on the site. MyMoneyBlog.com does not include all card companies or all available card offers. All opinions expressed are the author’s alone, and has not been provided nor approved by any of the companies mentioned.

MyMoneyBlog.com is also a member of the Amazon Associate Program, and if you click through to Amazon and make a purchase, I may earn a small commission. Thank you for your support.


Stacking VTI or VOO: Get Excited About S&P 500 and US Total Market Stock ETFs

My Money Blog has partnered with CardRatings and may receive a commission from card issuers. Some or all of the card offers that appear on this site are from advertisers and may impact how and where card products appear on the site. MyMoneyBlog.com does not include all card companies or all available card offers. All opinions expressed are the author’s alone.

A satoshi, or “sat” for short, is the smallest unit of the cryptocurrency bitcoin. “Stacking Sats” is a popular term for gradually accumulating bitcoin by purchasing small amounts of bitcoin at a time. (100 million sats = 1 bitcoin.) The idea is that you should be excited about adding any amount to your stack, focusing on that forward progress instead of the current market price.

If only it would be as trendy for folks to “stack VOO” or “stack VTI”. A low-cost S&P 500 or US Total Market index ETF is a tax-efficient way to build up your ownership of a share of excellent American businesses. Unfortunately, there is always something shinier next to this vanilla product. Factor ETFs, themed ETFs, sector ETFs, and so on. John Rekenthaler of Morningstar has an interesting series of articles comparing the long-term returns of various alternatives to Vanguard index funds. See Vanguard’s Other Index-Fund Invention.

Even way back in 1992, Vanguard started offering “Value” and “Growth” index funds, essentially splitting the US stock market into two halves based on price/book ratios. Essentially, these were the first variation on the plain S&P 500 index fund. You might think one was better than other. (Most academics would have guessed Value would win.) So what happened over the next 20 years? Not very much! (Plus Growth won slightly.)

Of course, I would not be surprised at all to see Value squeak out a slight win over Growth after another 10 or 20 years. One is always going to be winning slightly, but take a step back and you can argue they are effectively tied. Why not just own the S&P 500 index fund and get the average?

(Quick reminder: The Rule of 72 says that 10% annualized means your money will double every 7.2 years. That means $10,000 will have doubled three times in about 21 years. $10k doubled to $20k, then doubled to $40k, then doubled to $80k!)

What if you rebalanced regularly between Value and Growth? If you rebalanced between the two funds every single month, your annual return would have increased by 0.10%. If you rebalanced between the two funds only once every 5 years, your annual return would have increased by 0.28%. But really, who rebalances only once every 5 years? In view, these numbers are still low enough to be in the noise range, and the extra return is not dependable.

What if you bought a low-cost actively-managed fund from Vanguard instead? Due much to Vanguard’s extremely low costs on their active funds, some actively-managed funds did do better, but others did worse. If you chose to buy the funds with the highest trailing returns, or the best Sharpe ratios, or the most popular funds (most assets), all that Ivy League brainpower and decades of investing experience would have still lagged behind a simple index fund portfolio. Only with the power to see the future would you have picked the index-beating funds.

As the saying goes, don’t let the pursuit of perfect be the enemy of the good. As someone sitting on a relatively big pile of VTI after 15+ years of stacking it share by share, I am certainly relieved that I didn’t get too distracted by all of the other shiny objects out there. Instead of remembering your highest portfolio value ever from your monthly statement, remember the number of shares of VTI or VOO that you own. Every $200 saved = 1 share of VTI. But in the end, as long as you get excited about stacking something of high-quality with long-term productive value, you’ll likely end up in a good place.

My Money Blog has partnered with CardRatings and may receive a commission from card issuers. Some or all of the card offers that appear on this site are from advertisers and may impact how and where card products appear on the site. MyMoneyBlog.com does not include all card companies or all available card offers. All opinions expressed are the author’s alone, and has not been provided nor approved by any of the companies mentioned.

MyMoneyBlog.com is also a member of the Amazon Associate Program, and if you click through to Amazon and make a purchase, I may earn a small commission. Thank you for your support.


Don’t Anchor Yourself To Your Portfolio High-Water Mark

My Money Blog has partnered with CardRatings and may receive a commission from card issuers. Some or all of the card offers that appear on this site are from advertisers and may impact how and where card products appear on the site. MyMoneyBlog.com does not include all card companies or all available card offers. All opinions expressed are the author’s alone.

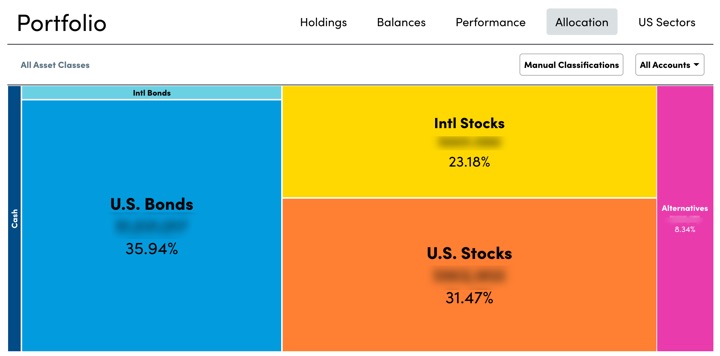
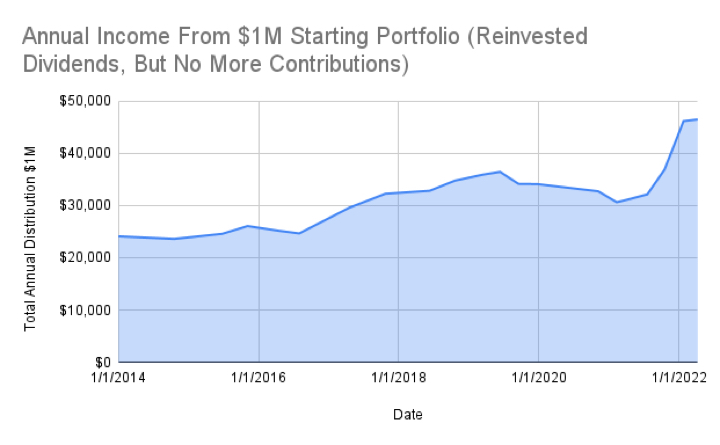
Inside various financial forums, I am seeing the “anyone else worried?” 😓 posts as most portfolios are down double-digits. For a retiree with a $1 million portfolio, seeing $100,000 or $200,000 of value evaporate is understandably stressful. However, much of this is because you are comparing to your portfolio’s all-time high, or high-water mark, which is a relatively arbitrary number. Just because at one moment in time, there were a few willing buyers of your assets for a given price doesn’t mean you should anchor yourself to that number.

Step back and have some perspective. I would offer up this historical performance chart of the Vanguard Target Retirement 2050 Fund (VFIFX) as evidence that things really aren’t that bad if you take a step back. This chart tracks the growth of a $10,000 investment place in 2012 in this all-in-one Target Date Fund. Taken 5/30/22.

  • As of 5/30/22, the 10-year trailing return for VFIFX is 10.28% annualized even after the recent drop. Can you reasonably ask for more than 10% average annual returns for a decade?
  • If you invested in January 2020, right before the COVID pandemic started, you are still up 18.7% if you held through today.
  • If you invested funds anytime between January and August 2020, those funds are up even more than that!
  • The last time your investment value was this low was… March 2021. That’s it.

Things might get much worse, things might get better and never look back, I don’t know the future. This is another reason why I no longer check my portfolio balance on a daily basis. How can I say that, when his whole blog was once based on the idea that I would share my net worth every month?! Back then my savings rate was much more significant than my portfolio performance. Side hustle money made a big difference and I felt in control. These days, the opposite is true. The portfolio movement overwhelms our savings contributions.

Track something better. If you keep staring at that portfolio balance, you’ll get overly excited when you hit an arbitrary number like $50,000 and then get really depressed if it drops below and stays there for a while. You need to track something better. If you are still in the accumulation phase, your metric for success could be:

  • Your 401(k) contribution rate. A reasonable target might be 15% or higher.
  • Your overall savings rate. Heck, if you are tracking this number at all, you are probably way ahead of the game.
  • Your side hustle monthly total. If your day job has a fixed salary, you might focus on the side income instead.
  • Your portfolio’s 2-year trailing average or similar. Anything that has a longer time horizon and offers more perspective.

If you are in the spending phase, you could track something like your spending rate as a percentage of portfolio, and if that’s still reasonable then go back to enjoying your life. You may also explore a dynamic spending strategy.

Bottom line. Your quoted portfolio value in November or December 2021 doesn’t matter. If you tell yourself stuff like “I’ve lost $XX,000” since December 2021, you are experiencing the anchoring cognitive bias.

My Money Blog has partnered with CardRatings and may receive a commission from card issuers. Some or all of the card offers that appear on this site are from advertisers and may impact how and where card products appear on the site. MyMoneyBlog.com does not include all card companies or all available card offers. All opinions expressed are the author’s alone, and has not been provided nor approved by any of the companies mentioned.

MyMoneyBlog.com is also a member of the Amazon Associate Program, and if you click through to Amazon and make a purchase, I may earn a small commission. Thank you for your support.


Investment Portfolio First Aid for Older Relative, Part 1: Assess The Situation

My Money Blog has partnered with CardRatings and may receive a commission from card issuers. Some or all of the card offers that appear on this site are from advertisers and may impact how and where card products appear on the site. MyMoneyBlog.com does not include all card companies or all available card offers. All opinions expressed are the author’s alone.

Although I enjoy managing my own investments, I’ve generally avoided managing other people’s money. That always felt like such an important responsibility to take on. Below is the real investment portfolio of an older family member (over 75) that is professionally managed by an large “brand name” financial firm. Understandably, the recent market volatility has hurt the balance and there is some concern, so I took a look.

Before opening up the statement, I joked to myself “There better not be that ARK ETF in there!”…. and there it was. Down 66%! 😱 Deep breaths! My thoughts went to the four basic steps to performing emergency first aid:

  1. Assess the situation
  2. Plan for interventions
  3. Implement first aid
  4. Evaluate the situation.

Here are some anonymized screenshots (with permission) that show holdings, balances, performance, and rough asset allocation breakdown.

Why in the world does this portfolio only have 10% in bonds, at least according to the pie chart above? What exactly are those “alternatives”? I created a Google spreadsheet and started collecting more data from Morningstar:

The Goldman Sachs “multistrategy” fund turns out to consist of roughly 50% net stocks and 50% net cash/bonds. So the overall asset allocation is about 80% stocks and 20% bonds. Perhaps they confused the “age in bonds” rule of thumb with “age in stocks”? 🤔

I don’t know all the details and communications that took place before the creation and implementation of this portfolio, but my first impression is not positive. In addition to an overly-aggressive asset allocation, I see a mishmash of high-cost mutual funds. There isn’t a single penny in a low-cost index fund as a core holding! I don’t believe that you need 15 different funds to be “diversified”. While a relatively small holding, the fact that ARK ETF holdings are down 67% also means they decided to buy in after all of the initial outperformance. In other words, performance chasing.

Speaking of performance, the portfolio is down 25% from the initial purchase amounts. That’s seems like a lot for someone in their 70s, and we haven’t even technically hit a bear market in the S&P 500 yet.

My Money Blog has partnered with CardRatings and may receive a commission from card issuers. Some or all of the card offers that appear on this site are from advertisers and may impact how and where card products appear on the site. MyMoneyBlog.com does not include all card companies or all available card offers. All opinions expressed are the author’s alone, and has not been provided nor approved by any of the companies mentioned.

MyMoneyBlog.com is also a member of the Amazon Associate Program, and if you click through to Amazon and make a purchase, I may earn a small commission. Thank you for your support.


Savings I Bonds May 2022 Inflation Update: 9.62% Interest Rate!

My Money Blog has partnered with CardRatings and may receive a commission from card issuers. Some or all of the card offers that appear on this site are from advertisers and may impact how and where card products appear on the site. MyMoneyBlog.com does not include all card companies or all available card offers. All opinions expressed are the author’s alone.

May 2022 rate confirmed at 9.62%. Official press release. The variable inflation-indexed rate for I bonds bought from May 1, 2022 through October 31, 2022 will indeed be 9.62% as predicted. Every single I bond will earn this rate eventually for 6 months, depending on the initial purchase month. The fixed rate (real yield) is also 0% as predicted. Still a good deal.

See you again in mid-October for the next early prediction for November 2022.

Original post 4/12/22:

Inflation (and thus I Bonds) 🚀🚀🚀! Savings I Bonds are a unique, low-risk investment backed by the US Treasury that pay out a variable interest rate linked to inflation. With a holding period from 12 months to 30 years, you could own them as an alternative to bank certificates of deposit (they are liquid after 12 months) or bonds in your portfolio.

New inflation numbers were just announced at BLS.gov, which allows us to make an early prediction of the May 2022 savings bond rates a couple of weeks before the official announcement on the 1st. This also allows the opportunity to know exactly what a April 2022 savings bond purchase will yield over the next 12 months, instead of just 6 months. You can then compare this against a May 2022 purchase.

New inflation rate prediction. September 2021 CPI-U was 274.310. March 2022 CPI-U was 287.504, for a semi-annual increase of 4.81%. Using the official formula, the variable component of interest rate for the next 6 month cycle will be 9.62%. You add the fixed and variable rates to get the total interest rate. The fixed rate hasn’t been above 0.50% in over a decade, but if you have an older savings bond, your fixed rate may be up to 3.60%.

Tips on purchase and redemption. You can’t redeem until after 12 months of ownership, and any redemptions within 5 years incur an interest penalty of the last 3 months of interest. A simple “trick” with I-Bonds is that if you buy at the end of the month, you’ll still get all the interest for the entire month – same as if you bought it in the beginning of the month. It’s best to give yourself a few business days of buffer time. If you miss the cutoff, your effective purchase date will be bumped into the next month.

Buying in April 2022. If you buy before the end of April, the fixed rate portion of I-Bonds will be 0%. You will be guaranteed a total interest rate of 0.00 + 7.12 = 7.12% for the next 6 months. For the 6 months after that, the total rate will be 0.00 + 9.62 = 9.62%.

Let’s look at a worst-case scenario, where you hold for the minimum of one year and pay the 3-month interest penalty. If you theoretically buy on April 30th, 2022 and sell on April 1st, 2023, you’ll earn a ~6.51% annualized return for an 11-month holding period, for which the interest is also exempt from state income taxes. If you theoretically buy on April 30th, 2022 and sell on July 1, 2023, you’ll earn a ~7.17% annualized return for an 14-month holding period. Comparing with the best interest rates as of April 2022, you can see that this is much higher than a current top savings account rate or 12-month CD.

Buying in May 2022. If you buy in May 2022, you will get 9.62% plus a newly-set fixed rate for the first 6 months. The new fixed rate is officially unknown, but is loosely linked to the real yield of short-term TIPS, and is thus very, very, VERY likely to be 0%. Every six months after your purchase, your rate will adjust to your fixed rate (set at purchase) plus a variable rate based on inflation.

If you have an existing I-Bond, the rates reset every 6 months depending on your purchase month. Your bond rate = your specific fixed rate (based on purchase month, look it up here) + variable rate (total bond rate has a minimum floor of 0%). So if your fixed rate was 1%, you’ll be earning a 1.00 + 9.62 = 10.62% rate for six months.

Buy now or wait? Given that the current I bond rate is already much higher than the equivalent alternatives, I would personally buy in April to lock in the high rate for the longest possible time. Who knows what will happen on the next reset? I already purchased up to the limits first thing in January 2022. You are also getting a much better “deal” than with TIPS, as the fixed rate is currently negative with short-term TIPS.

Unique features. I have a separate post on reasons to own Series I Savings Bonds, including inflation protection, tax deferral, exemption from state income taxes, and educational tax benefits.

Over the years, I have accumulated a nice pile of I-Bonds and consider it part of the inflation-linked bond allocation inside my long-term investment portfolio. Right now, the inflation protection “insurance” is paying off with high yields and no principal risk.

Annual purchase limits. The annual purchase limit is now $10,000 in online I-bonds per Social Security Number. For a couple, that’s $20,000 per year. You can only buy online at TreasuryDirect.gov, after making sure you’re okay with their security protocols and user-friendliness. You can also buy an additional $5,000 in paper I bonds using your tax refund with IRS Form 8888. If you have children, you may be able to buy additional savings bonds by using a minor’s Social Security Number. TreasuryDirect also allows trust accounts to purchase savings bonds.

Note: Opening a TreasuryDirect account can sometimes be a hassle as they may ask for a medallion signature guarantee which requires a visit to a physical bank or credit union and snail mail. Don’t expect to be able to open an account in 5 minutes on your phone.

Bottom line. Savings I bonds are a unique, low-risk investment that are linked to inflation and only available to individual investors. Right now, they promise to pay out a higher fixed rate above inflation than TIPS. You can only purchase them online at TreasuryDirect.gov, with the exception of paper bonds via tax refund. For more background, see the rest of my posts on savings bonds.

[Image: 1950 Savings Bond poster from US Treasury – source]

My Money Blog has partnered with CardRatings and may receive a commission from card issuers. Some or all of the card offers that appear on this site are from advertisers and may impact how and where card products appear on the site. MyMoneyBlog.com does not include all card companies or all available card offers. All opinions expressed are the author’s alone, and has not been provided nor approved by any of the companies mentioned.

MyMoneyBlog.com is also a member of the Amazon Associate Program, and if you click through to Amazon and make a purchase, I may earn a small commission. Thank you for your support.


Know What You Own: Real Estate Investment Trusts (REIT) Infographic

My Money Blog has partnered with CardRatings and may receive a commission from card issuers. Some or all of the card offers that appear on this site are from advertisers and may impact how and where card products appear on the site. MyMoneyBlog.com does not include all card companies or all available card offers. All opinions expressed are the author’s alone.

Often you’ll hear investment advice like “just buy an index fund and forget about it”, but when a severe crisis occurs, it’s really hard to just forget about it. Substitute advice like “sell now and wait for the dust to settle” may start to sound equally wise. It’s harder to maintain faith in an investment if you don’t understand what you actually own.

As an example, I own real estate investment trusts, and Visual Capitalist just published a handy infographic on The World’s Largest Real Estate Investment Trusts. They are all headquartered in the United States, which makes them also the top 10 holdings of the Vanguard Real Estate ETF (VNQ).

In fact, these ten companies make up about 50% of VNQ. Here’s a quick peek at what specific types of real estate properties these companies own.

  • Prologis. This industrial REIT manages things like warehouses and distribution centers. Their largest customers are Amazon.com, Home Depot, and FedEx.
  • American Tower. This communications REIT owns communications infrastructure like cellular towers. Their largest customers are AT&T, T-Mobile, and Verizon.
  • Crown Castle. This communications REIT owns communications infrastructure like cellular towers. Their largest customers are AT&T, T-Mobile, and Verizon.
  • Public Storage. This self-storage REIT is the largest self-storage brand in the US.
  • Equinix. This data center REIT manages internet connection and data centers. Their customers include Amazon, Apple, AT&T, Meta/Facebook, and Nokia.
  • Simon Property Group. This mall REIT manages shopping malls, outlet centers, and community/lifestyle centers. The largest of their 200+ properties all around the country is King of Prussia in Philadelphia.
  • Welltower. This healthcare REIT owns senior housing (independent living, assisted living and memory care communities), post-acute care, and outpatient care centers.
  • Digital Realty. This data center REIT owns “carrier-neutral data centers and provides colocation and peering services” for hundreds of large companies.
  • Realty Income. This commercial REIT specializes in free-standing, single-tenant commercial properties that work on triple net lease agreements (the lessee handles property taxes, insurance, and maintenance on the properties). Largest tenants include Walgreens, Dollar General, 7-11, and Dollar Tree.
  • AvalonBay Communities. This residential REIT invests in apartment complexes.

REITs own a wide variety of real estate that touch our lives every day. You may live in or drive by an apartment complex, shop at a Walgreens, have your Amazon order shipped from, connect your phone to 4G/5G from, or be browsing a website that pays rent to one of these companies. When the next crisis inevitably occurs, you should remember that your investment in REITs owns a part of all these physical properties. Yes, their stock market price may drop for a while, but you are still owning critical infrastructure for the economy that isn’t going anywhere.

With a market-cap weighting, you will always own the most successful REITs. Would I have invested in data centers on my own? Cell towers? Public storage? The good news is that I don’t need to know.

Here is the historical chart for the Vanguard REIT ETF (VNQ). $10,000 invested at inception in 1996 would be worth $130,000 today with dividends reinvested. A traditional rental property would have also appreciated a lot over the last 25 years, but there are also several variables in the mix (leverage via mortgage, interest paid, repair/maintenance costs, time spent, taxes, deprecation, deferred capital gains, etc.) I am still fascinated by the idea, but for now owning real property via REITs suits my lifestyle and personality much better.

My Money Blog has partnered with CardRatings and may receive a commission from card issuers. Some or all of the card offers that appear on this site are from advertisers and may impact how and where card products appear on the site. MyMoneyBlog.com does not include all card companies or all available card offers. All opinions expressed are the author’s alone, and has not been provided nor approved by any of the companies mentioned.

MyMoneyBlog.com is also a member of the Amazon Associate Program, and if you click through to Amazon and make a purchase, I may earn a small commission. Thank you for your support.


MMB Portfolio 2022 1st Quarter Update: Dividend & Interest Income

My Money Blog has partnered with CardRatings and may receive a commission from card issuers. Some or all of the card offers that appear on this site are from advertisers and may impact how and where card products appear on the site. MyMoneyBlog.com does not include all card companies or all available card offers. All opinions expressed are the author’s alone.

via GIPHY

Here’s a slightly-altered quarterly update on the income produced by my Humble Portfolio. I track the income produced as way to add a different view of performance. The total income goes up much more gradually and consistently than the number shown on brokerage statements (price), which helps encourage consistent investing. I imagine them as building up a factory that churns out dollar bills.

Annual income history. I started tracking the income from my portfolio in 2014. Here’s what the annual distributions from my portfolio look like over time:

  • $1,000,000 invested in my portfolio as of January 2014 would have generated about $24,000 in annual income over the previous 12 months. (2.4% starting yield)
  • If I reinvested the income but added no other contributions, today in 2022 it would have generated ~$46,000 in annual income over the previous 12 months.
  • If I spent every penny of the income every single year instead, today in 2022 it would still have generated ~$36,000 in annual income over the previous 12 months.

This chart shows how the annual income generated by my portfolio has changed.

TTM income yield. To estimate the income from my portfolio, I use the weighted “TTM” or “12-Month Yield” from Morningstar, which is the sum of the trailing 12 months of interest and dividend payments divided by the last month’s ending share price (NAV) plus any capital gains distributed (usually zero for index funds) over the same period. The trailing income yield for this quarter was 2.51%, as calculated below. Then I multiply by the current balance from my brokerage statements to get the total income.

Asset Class / Fund % of Portfolio Trailing 12-Month Yield Yield Contribution
US Total Stock (VTI) 25% 1.30% 0.33%
US Small Value (VBR) 5% 1.77% 0.09%
Int’l Total Stock (VXUS) 25% 3.21% 0.80%
Emerging Markets (VWO) 5% 2.96% 0.15%
US Real Estate (VNQ) 6% 2.78% 0.17%
Inter-Term US Treasury Bonds (VGIT) 17% 1.19% 0.20%
Inflation-Linked Treasury Bonds (VTIP) 17% 4.52% 0.77%
Totals 100% 2.51%


Stock market dividend growth over time. Stock dividends are a portion of profits that businesses have decided they don’t need to reinvest into their business. The dividends may suffer some short-term drops, but over the long run they have grown faster than inflation. The ratio of dividend payouts to price also serve as a rough valuation metric. When stock prices drop, this percentage metric usually goes up – which makes me feel better in a bear market. When stock prices go up, this percentage metric usually goes down, which keeps me from getting too euphoric during a bull market.

Here’s a related quote from Jack Bogle (source):

The true investor will do better if he forgets about the stock market and pays attention to his dividend returns and to the operating results of his companies.

If you retired back in 2014 and have been living off your stock/bond portfolio, your total income distributions are much higher in 2022 than in 2014. Here is the historical growth of the S&P 500 total dividend, which tracks roughly the largest 500 stocks in the US, updated as of Q1 2022 (via Yardeni Research):

This means that if you owned enough of the S&P 500 to produce an annual dividend income of about $26,000 a year in 1999, then today those same shares would be worth a lot more AND your annual dividend income would have increased to over $100,000 a year, even if you had spent every penny of dividend income every year!

Here is the historical growth of the total dividend of the EAFE iShares MSCI ETF, which tracks a broad index of developed non-US stocks (VXUS is a newer ETF), via Netcials.

European corporate culture seems to encourage paying out a higher percentage of earnings as dividends, but is also more forgiving of adjusting the dividends up and down with earnings. US corporate culture tends to be more conservative, with the expectation that dividends will be growing or at least stable. This is not true across every company, just a general observation.

Use as a retirement planning metric. It’s true that during the accumulation stage, your time is better spent focusing on earning potential via better career moves, improving in your skillset, and/or looking for entrepreneurial opportunities where you can have an ownership interest. As an overall numerical goal, I support the simple 4% or 3% rule of thumb, which equates to a target of accumulating roughly 25 to 30 times your annual expenses. I would lean towards a 3% withdrawal rate if you want to retire young (before age 50) and a 4% withdrawal rate if retiring at a more traditional age (closer to 65).

However, I find that tracking income makes more tangible sense in my mind and is more useful for those who aren’t looking for a traditional retirement. Our dividends and interest income are not automatically reinvested. They are another “paycheck”. Then, as with a traditional paycheck, we can choose to either spend it or invest it again to compound things more quickly. Even if we spend the dividends, this portfolio paycheck will still grow over time. You could use this money to cut back working hours, pursue a different career path, start a new business, take a sabbatical, perform charity or volunteer work, and so on. This is your one life and it only lasts about 4,000 weeks.

My Money Blog has partnered with CardRatings and may receive a commission from card issuers. Some or all of the card offers that appear on this site are from advertisers and may impact how and where card products appear on the site. MyMoneyBlog.com does not include all card companies or all available card offers. All opinions expressed are the author’s alone, and has not been provided nor approved by any of the companies mentioned.

MyMoneyBlog.com is also a member of the Amazon Associate Program, and if you click through to Amazon and make a purchase, I may earn a small commission. Thank you for your support.