I try to limit checking my portfolio to once a quarter, and this is my 2025 Q1 update that includes our combined 401k/403b/IRAs and taxable brokerage accounts but excluding our house and side portfolio of self-directed investments. Following the concept of skin in the game, the following is not a recommendation, but a sharing of our actual, imperfect DIY portfolio.
“Never ask anyone for their opinion, forecast, or recommendation. Just ask them what they have in their portfolio.” – Nassim Taleb
How I Track My Portfolio
Here’s how I track my portfolio across multiple brokers and account types:
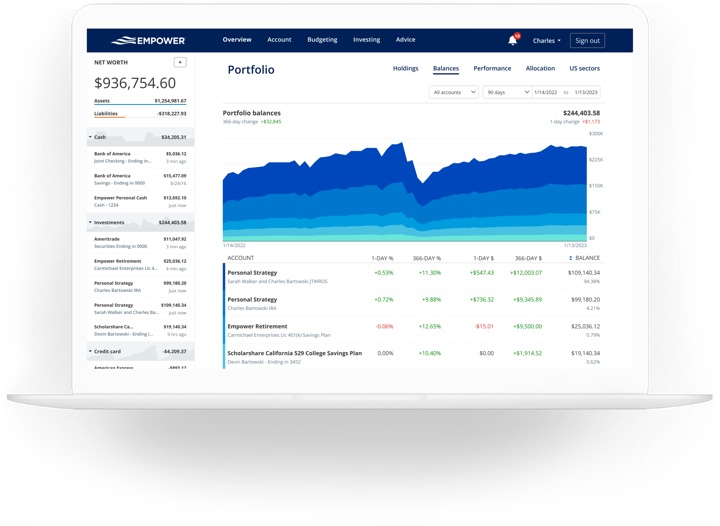
- The Empower Personal Dashboard real-time portfolio tracking tools (free) automatically logs into my different accounts, adds up my various balances, tracks my performance, and calculates my overall asset allocation daily. Formerly known as Personal Capital.
- Once a quarter, I also update my manual Google Spreadsheet (free to copy, instructions) because it helps me calculate how much I need in each asset class to rebalance back towards my target asset allocation. I also create a new tab each quarter, so I have a personal archive of my net worth dating back many years.
2025 Q1 Asset Allocation and YTD Performance
Here are updated performance and asset allocation charts, per the “Holdings” and “Allocation” tabs of my Empower Personal Dashboard.

The major components of my portfolio are broad index ETFs. I do mix it up a bit around the edges, but not very much. Here is a breakdown of my target asset allocation along with my primary ETF holding for each asset class.
- 35% US Total Market (VTI)
- 5% US Small-Cap Value (VBR/AVUV)
- 20% International Total Market (VXUS)
- 5% International Small-Cap Value (AVDV)
- 5% US Real Estate (REIT) (VNQ)
- 20% US “Regular” Treasury Bonds or FDIC-insured deposits
- 10% US Treasury Inflation-Protected Bonds
Big picture, it is 70% businesses and 30% very safe bonds/cash:
By paying minimal costs including management fees, transaction spreads, and tax drag, I am trying to essentially guarantee myself above-average net performance over time.
I do not spend a lot of time backtesting various model portfolios, as I don’t think picking through the details of the recent past will necessarily create superior future returns. You’ll usually find that whatever model portfolio is popular at the moment just happens to hold the asset class that has been the hottest recently as well.
The portfolio that you can hold onto through the tough times is the best one for you. Every asset class will eventually have a low period, and you must have strong faith during these periods to earn those historically high returns. You have to keep owning and buying more stocks through the stock market crashes. You have to maintain and even buy more rental properties during a housing crunch, etc. A good sign is that if prices drop, you’ll want to buy more of that asset instead of less. I don’t have strong faith in the long-term results of commodities, gold, or bitcoin – so I don’t own them.
Performance details. According to Empower, the S&P 500 went down about 5% the first quarter of 2025, while foreign stocks went up around 7%. I don’t remember that happening for a while, and apparently it hasn’t happened since 2009 (see below;source). Overall, my portfolio was flat.
Over the last quarter, here’s a Growth of $10,000 chart courtesy of Testfolio for some of the major ETFs that shows the difference in performance in the broad indexes:
I always like to remember the big picture. Here’s an updated Morningstar Growth of $10,000 Chart for the Vanguard LifeStrategy Growth Fund (VASGX) which holds a static 80% stocks and 20% bonds and most closely mimics my portfolio since 2005, which is when I started investing more seriously and started this blog.

I’ll share about more about the income aspect in a separate post.
 The Best Credit Card Bonus Offers – 2025
 Big List of Free Stocks from Brokerage Apps
 Best Interest Rates on Cash - 2025
 Free Credit Scores x 3 + Free Credit Monitoring
 Best No Fee 0% APR Balance Transfer Offers
 Little-Known Cellular Data Plans That Can Save Big Money
 How To Haggle Your Cable or Direct TV Bill
 Big List of Free Consumer Data Reports (Credit, Rent, Work)
Planning on moving more into stocks valuations become more attractive?
My spreadsheet says that new cashflows should be put into US stocks, so that’s what I’m doing, but it’s a really small percentage of the overall portfolio. I usually don’t rebalance until things are really off-target by 5%.
Have you ever considered balancing some of your bonds and putting more into international bonds (something like BNDW)?
I should probably look into it more, but my position is mostly that I want my bonds to be boring and safe and international bonds don’t really do that. The US is still the safest option. With international bonds, you either add currency risk, or if you pay to hedge it like with BNDW, you then have more expensive bonds that aren’t safer.
It is plausible a situation where the US defaults and no other countries do, but I have trouble buying bonds from France or Italy (they make up over 15% of BNDX). If you look at the ratings agencies, the overall mix of BNDX is like 20% “junk” or non-investment grade and only 25% AAA.
dump the REIT fund into the S&P
🤔
Is merging data into Empower basically by setting up each brokerage account info into the system with ID and PW? I use Full View, Fidelity’s aggregation services at fidelity.com. Just curious if one system is more superior to another.
Yes, you just use your login and password, unless you want to manually type in your holdings instead. I haven’t used Full View in a while, but I don’t think Full View tracks the performance and breaks down the asset allocation of your entire portfolio together.